This tag relates to the discussions on the development of analytics and business intelligence solutions, visualization, KPI and other business metrics management.
I'm happy to share with the community a web server log dataset from our longtime customer, an operating company.
Their webserver operates on Apache webserver and contains data which can be useful to analyse a load and search engines activity.
After installing the project, you will get the data for a few months that can show a typical load and activity of clients, robots and also you can see how it depends on day of week, holidays and time of a day.
As said in the previous article about the iris-fhir-generative-ai experiment, the project logs all events for analysis. Here we are going to discuss two types of analysis covered by analytics embedded in the project:
I'm sure I'm not the only one who's already assembling matching pairs of socks for this year's Global Summit in Boston later this month . In case you haven't registered yet or are still looking for the right justification to get the eventual approval to attend, here's a quick overview of all the sessions around Data Management and Analytics:
In the previous part of this series, we saw how to reference a web page that will enhance our dashboard experience. Now we will look into referencing data that is already in our cubes.
In this example, we will be referencing the controller object and we will be extracting data from it. This data will then be displayed as text in our Dashboard. In Part 5, we will show how to incorporate this data into other charting libraries.
Did you catch an Experience Lab at the 2021 Virtual Summit? Head over to the InterSystems Learning siteto access all four of these hands-on exercises, and get up to speed on:
Fast transfer. Pass globals, classes and tables from InterSystems IRIS to Python with ease and speed (10x faster than old QueryExecute). Documentation.
https://www.youtube.com/embed/-AdK9sOwk50 [This is an embedded link, but you cannot view embedded content directly on the site because you have declined the cookies necessary to access it. To view embedded content, you would need to accept all cookies in your Cookies Settings]
TL;DR: My comment to Microsoft when I voted:Our team has implemented most of what we need for source management of Power BI Report files in Perforce. The missing piece?
With the release of InterSystems IRIS, we're also making available a nifty bit of software that allows you to get the best out of your InterSystems IRIS cluster when working with Apache Spark for data processing, machine learning and other data-heavy fun. Let's take a closer look at how we're making your life as a Data Scientist easier, as you're probably already facing tough big data challenges already, just from the influx of job offers in your inbox!
I recently discovered the Monitoring Activity Volume feature in IRIS and I was amazed by it. So, I put it to work in one of our productions. It is nice how easy it is to set up and all the possibilites that came with it.
But there's something weird: the numbers. Actually, one of the BP is stating a time of more than 6 seconds to process:
By design, DSW provides an implementation for every widget in DeepSee library. But there are some extra features in DSW which make solutions built with DSW dashboards more functional. This article describes it.
https://www.youtube.com/embed/z9O0F1ovBUY [This is an embedded link, but you cannot view embedded content directly on the site because you have declined the cookies necessary to access it. To view embedded content, you would need to accept all cookies in your Cookies Settings]
InterSystems Developer Community analytics. Project made with InterSystems IRIS BI (DeepSee), Power BI and Logi Report Designer to visualize and analyze members, articles, questions, answers, views and other pieces of content and activity on InterSystems Developer Community.
You can see your own activity, articles and questions. Track how your contribution changes developer community.
When analyzing data, there is often a need to look at specific indicators more thoroughly and to highlight sections of information of particular interest to a user.
For instance, examining the data dynamics for specific regions or dates can help us uncover some hidden trends and patterns that will allow us to make an informed decision about our project in the future.
In the previous part of this series, we saw how to include data in a portlet from within DeepSee. This used the built in data controller. In this part, we are going to be pulling in data from outside of DeepSee. This will include both information from within InterSystems IRIS and from the OS.
Why use this?
This is useful if you would like to create a dashboard that only contains information about your system. It is also useful if you want to display data about your system along side data that you have stored in DeepSee.
Hi All,
We have been using DeepSee which has been the integrated Analytic Dashboard built over Cache Cubes. It works fine but it's visual capabilities are limited and most probably is getting phased out.
If I am not wrong, Tableau is the suggested alternative to DeepSee . It is expensive and a big and considerable shift from existing technology
I wanted to get an opinion of the community as to these few key points
- What other BI tools others have been using with IRIS and what have been their experience
- For which tools are the best inbuilt support / api's avaialble in IRIS
We're excited to announce that we've completed our first Open Exchange submission for InterSystems platforms.
BridgeWorks VDM is an ad hoc reporting and graphical SQL query builder application that was designed for any user who needs access to their SQL projections in InterSystems Caché, InterSystems IRIS, InterSystems IRIS for Health databases as well as access to InterSystems DeepSee and InterSystems IRIS BI Cubes with minimal SQL scripting experience.
https://www.youtube.com/embed/-OwOAHC5b3s [This is an embedded link, but you cannot view embedded content directly on the site because you have declined the cookies necessary to access it. To view embedded content, you would need to accept all cookies in your Cookies Settings]
The following post outlines a more flexible architectural design for DeepSee. As in the previous example, this implementation includes separate databases for storing the DeepSee cache, DeepSee implementation and settings, and synchronization globals. This example introduces one new databases to store the DeepSee indices. We will redefine the global mappings so that the DeepSee indices are not mapped together with the fact and dimension tables.
Thank you all for your continued feedback and support of our ad hoc reporting platform, VDM. There's been some questions around setting up a non-ODBC connection for InterSystems platforms. We published a new YouTube video showing the steps necessary to connect to InterSystems Caché and InterSystems IRIS with BridgeWorks VDM.
System Monitor is a flexible and highly configurable tool supplied with Caché (Ensemble, HealthShare), which collects the essential metrics of the operating system and Caché itself. System Monitor also notifies administrators about issues with Caché and the operating system, when one or several parameters reach the admin-defined thresholds.
As we announced at our Global Summit in October, we are developing dedicated connectors for a number of third-party data visualization tools for InterSystems IRIS. With these connectors, we want to combine an excellent user experience with optimal performance when using those tools to visualize data managed on InterSystems IRIS Data Platform.
Running predictive models natively in an InterSystems IRIS Business Process has of course always been the goal of our PMML support, but somehow never made it into the kit because there were a few dependencies and choices that needed addressing and answering. Anyhow, thanks to some pushing and code kindly provided by @Amir Samary (Thanks again Amir!), we finally got it wrapped in a GitHub repo for your enjoyment, review and suggestions.
 By likes
 Open Exchange app
 . In case you haven't registered yet or are still looking for the right justification to get the eventual approval to attend, here's a quick overview of all the sessions around Data Management and Analytics:
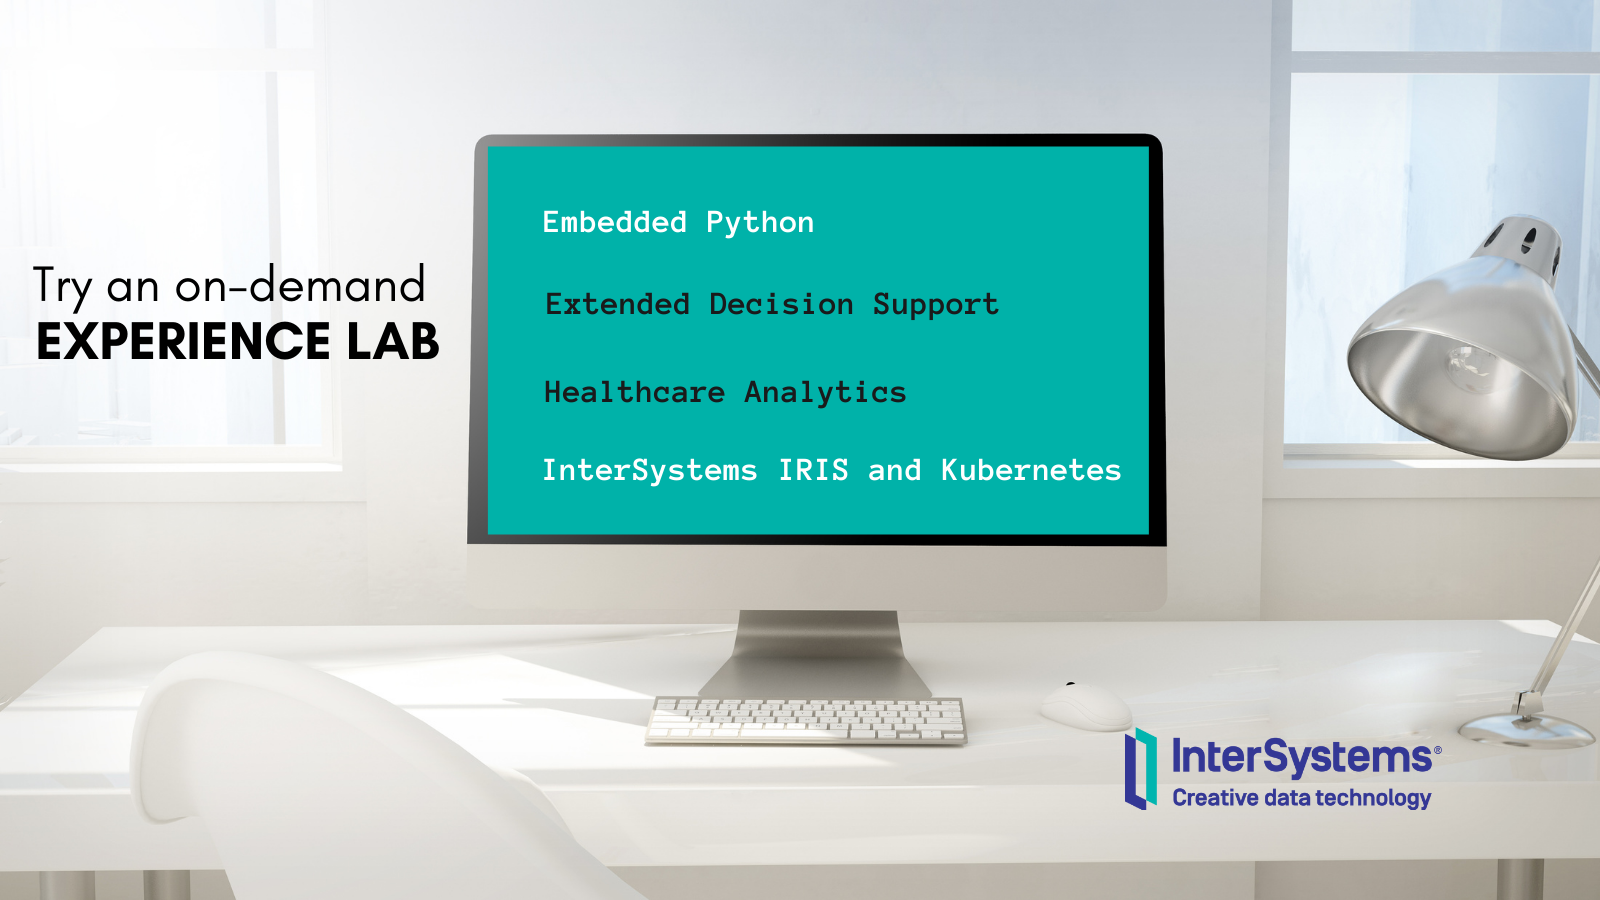
.png)


.png)