Visualising Analytics With DeepSee Web: Using Drill Down and Drill Through, Working With Pivot Tables and indicators
Hi, Community!
This is the 3rd part of DeepSee Web story - Angular base UI for DeepSee Dashboards, see the beginning here.

By design, DSW provides an implementation for every widget in DeepSee library. But there are some extra features in DSW which make solutions built with DSW dashboards more functional. This article describes it.
View data, Export data, Print data, Share data
Every DSW widget can be switched from graphic representation to a table - you can do it with small table switch in the right corner.
If you want to see the data not only in a table you can right-click on a widget and choose any other type of visualization either colchart, barchart, or area chart.
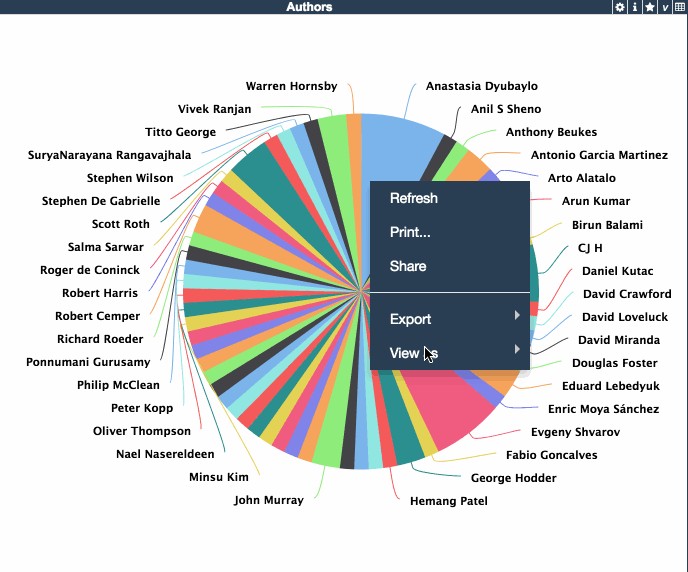
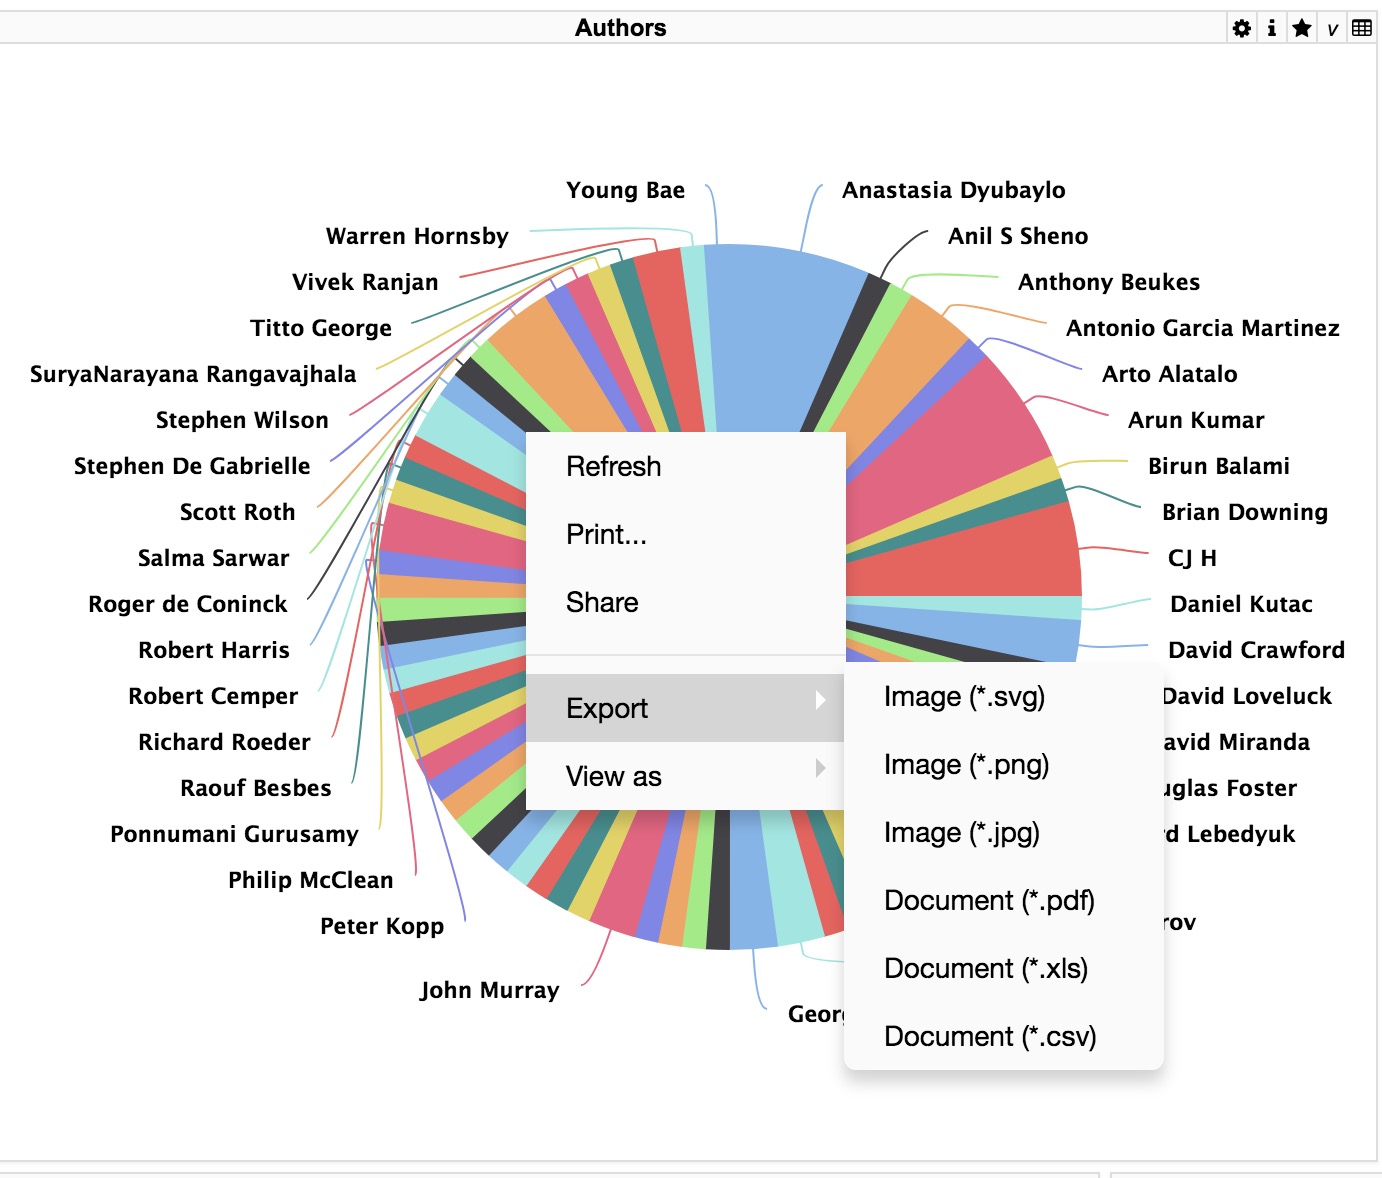
Also, widget's right-click menu provides the option of exporting the data in xls or csv formats and you can print the widget.
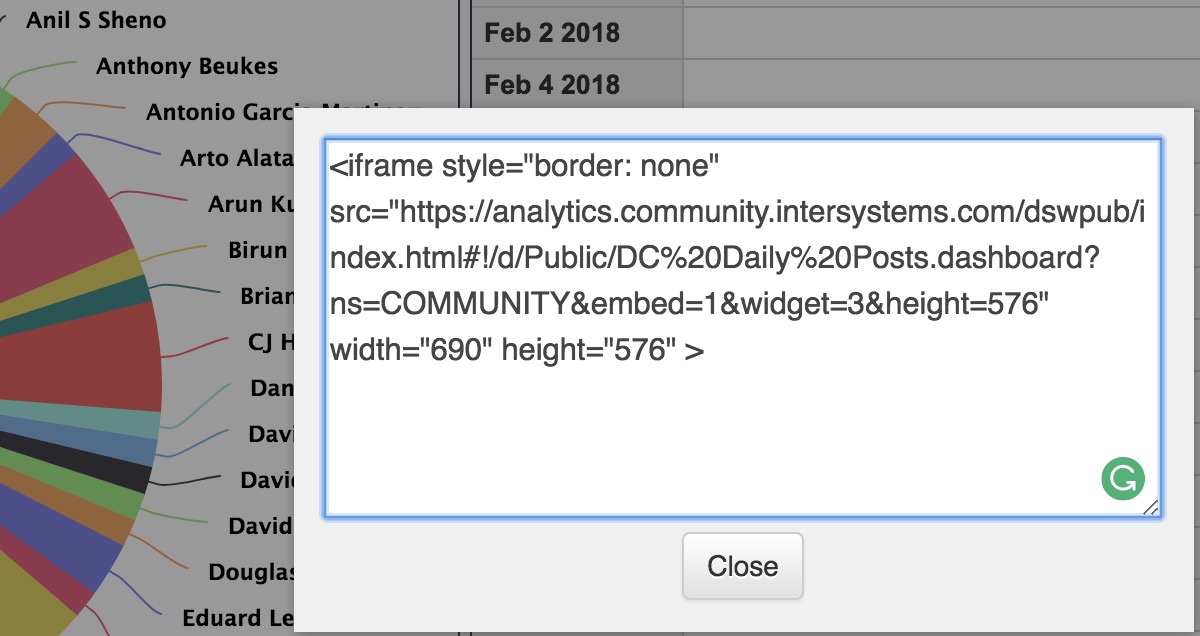
Share button in a context menu will give you the iframe code to embed the widget in your html page.
Drill down and Drillthrough
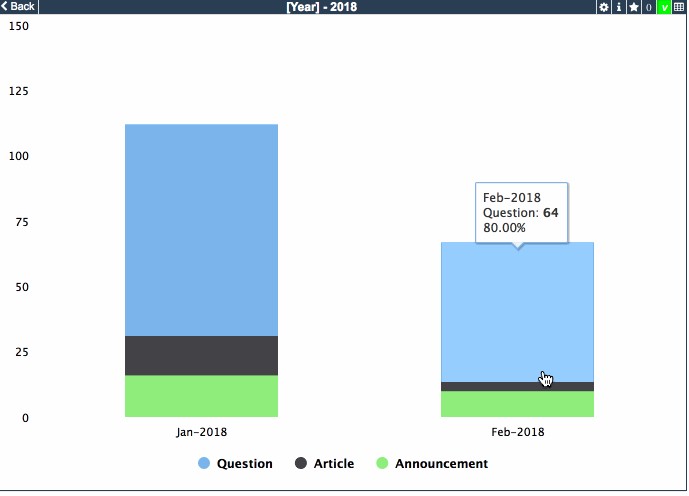
Every graphical widget in DeepSee Web supports drill down. So if the dimension of the source has a hierarchy you can see the next level of data by clicking an element on the widget. Click on the “back” button to return to the previous scope.
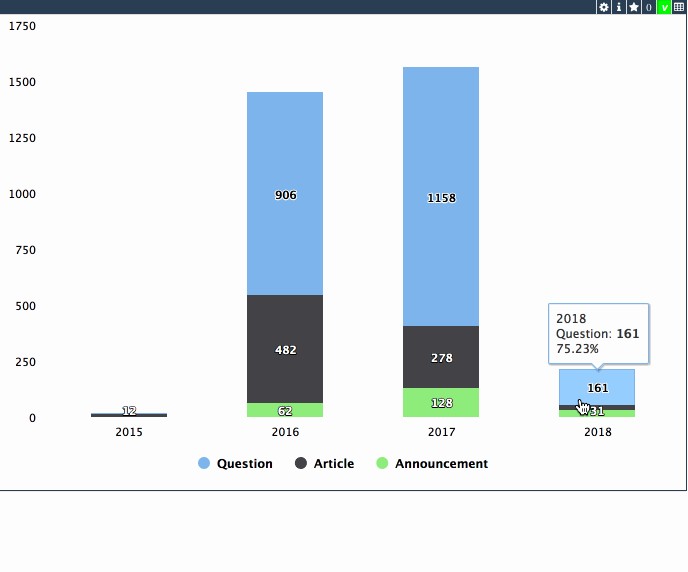
You can drill down in tables as well - click on the first cell in a row for this purpose.
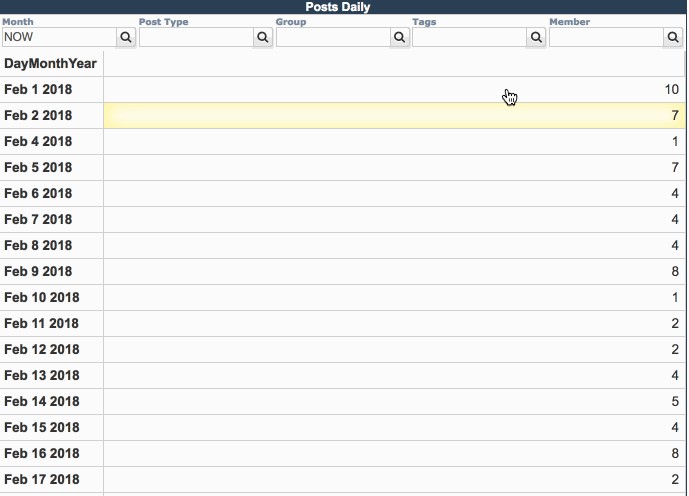
Also, if the cube has a listing of source data and you placed ‘Show listing’ control on a widget you can see the drill through data: elements of fact table which relates to a current slice of dimension data. Drillthrough rows are always shown in a table form. In a graphical widget, listing is shown when you click on a particular graphic element. In a table to see the drill through click on a particular cell.
Pivot table features
DeepSee pivot table widget functionality is so complex so we didn’t find an analog amongst any available js framework and implemented a pivot table for DeepSee in javascript from scratch. It is called Light Pivot Table and you can find the source code here.
So, DSW pivot table implements everything you have in native DeepSee widget(drill-down, layered headers, formatting, totals, etc) and also has some extra functionality which you may find helpful.
Adjustable column widths - you can alter the col width to see more data in cells.
Sorting data - click on a header to sort the rows in ascending or descending order or to cancel sorting.
Filter and search data in drillthrogh - pivot provides the drop-down with all the columns to let you filter and find rows which contain the particular value.
Link to click - if the data in a cell contains 'http' pivot table interprets it and lets a user click on the link. But you are very welcome to make a full functional <a> tag in a cell.
Examine and coping the data. In a drillthrough view you can click on a row to turn on a record detailed view. In this view, you can see all the fields of a record in a detailed view.
And also you can copy the data to a clipboard with the small button in the beginning of every value.
See the example:
Text Indicators “on steroids”
In DSW there is a simplified way to render text indicators.
To show the values with indicator widget you need two things:
-
The DeepSee source with one row and several named columns - each would be a value on an indicator.
-
Place an indicator on a dashboard with the source from 1.
That’s it.
Let’s see how it works with indicators on figures on developer community:
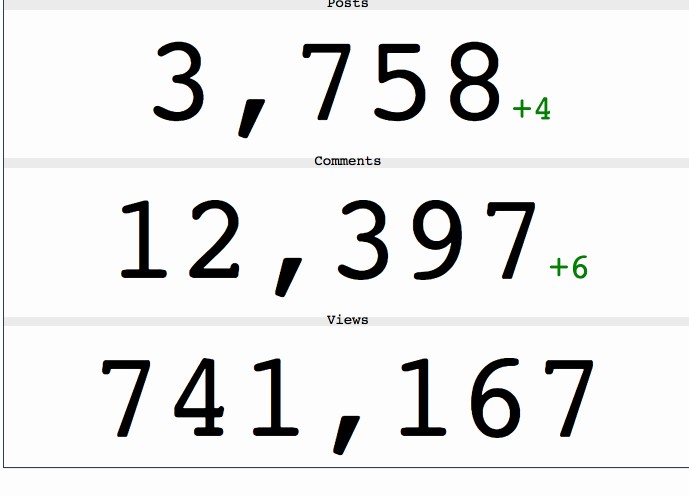
Often the figure itself doesn’t tell us much - we need to know how it differs from tomorrow, from average value etc.
To manage this DSW provides special names for columns. Put a col with title ‘deltaN’ and indicator will show the positive or negative addict to a figure. E.g. column with title ‘delta1’ will show the value in column ‘delta1’ with green for positive or red for negative color as subindex to the first value of the indicator.
I showed all the examples with DC analytics, which you can examine here or clone this repository and play in your own Caché, Ensemble, InterSystems IRIS!
See also the first and the second parts of DSW saga.
Next story about DSW would describe how to cook interactive maps with data. Stay tuned!