Portlets that use data from DeepSee
In the previous part of this series, we saw how to reference a web page that will enhance our dashboard experience. Now we will look into referencing data that is already in our cubes.
In this example, we will be referencing the controller object and we will be extracting data from it. This data will then be displayed as text in our Dashboard. In Part 5, we will show how to incorporate this data into other charting libraries.
Why use this?
The controller object contains data from an MDX result set. This is the first step to using advanced portlets, such as using a third party charting library (which will be discussed in Part 5) or it can decide which web page URL to embed (Part 2).
What will we learn?
This example will demonstrate how to interact with the controller object.
What is the controller object?
The controller object is automatically populated with the MDX Result Set information+data based on the Widget's Data Source.
Implementation
We will start with the portlet code from Part 1.
1) We are going to modify our renderContents method in our portlet. Start with removing the following line.
html[html.length]="Testing"2) We will now get our controller object.
this.connectToController();
var controller = this.getController();
3) Now that we have our controller object, we can start extracting information about it. We will print the object to the console so we can fully inspect it. Please use your browser's developer tools to view this information.
console.log(controller);4) In addition to printing the object to the browser console, we will also add some information to the portlet.
html[html.length] = "Current Query Text: "+controller.GetCurrentQueryText();
html[html.length] = "</br>Number of columns: "+controller.getDimSize(2);
html[html.length] = "</br>Number of rows: "+controller.getDimSize(1);
5) If we want to build our own HTML table, we can do the following.
html[html.length] = "<table border='1'>";
// Add Headers
html[html.length] = "<tr>";
html[html.length] = "<th></th>";
for (var col=0;col<controller.getDimSize(2); col++) {
html[html.length] = "<th>"+controller.getLabel(col,2)+"</th>";
}
html[html.length] = "</tr>";
for (var row=0;row<controller.getDimSize(1); row++) {
html[html.length] = "<tr>";
html[html.length] = "<td>"+controller.getLabel(row,1)+"</td>";
for (var col=0;col<controller.getDimSize(2); col++) {
var cell=(row*controller.getDimSize(2))+col
html[html.length] = "<td>"+controller.data.cells[cell]+"</td>";
}
html[html.length] = "</tr>";
}
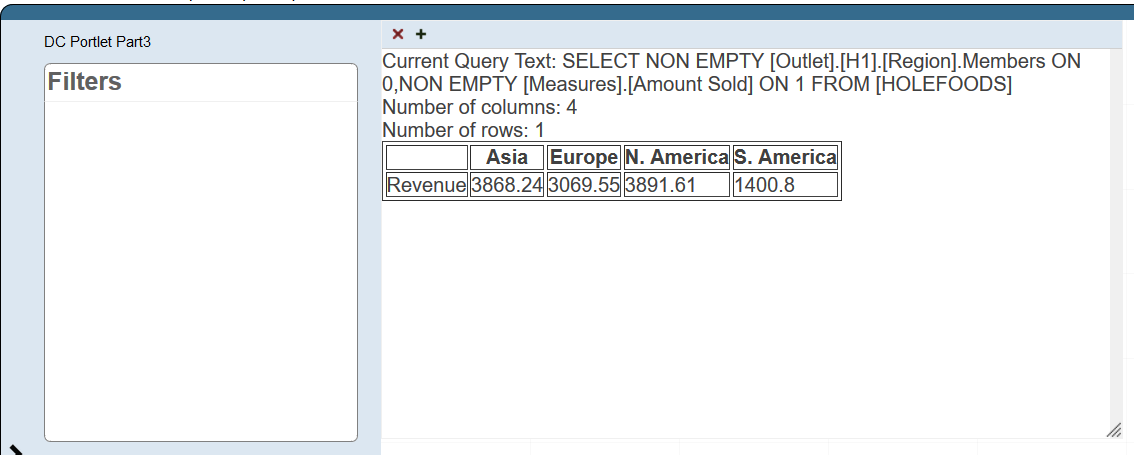
html[html.length] = "</table>";Please note that depending on the structure of the query and the table, this code will need to be much more dynamic if you would like to create your own table.
With this code, our portlet now looks like:
Other Articles in this series
Part 1 - Creating Portlets in DeepSee
Part 2 - Portlets that embed web pages into DeepSee dashboards
Part 4 - Using data outside of DeepSee
Part 5 - Using third party charting libraries
The code for this example can be found on Open Exchange.