New
Hi folks!
Our community is growing rapidly, and the knowledge base is incredibly vast. Whether you're a newbie, confused, and unsure where to start, or a seasoned IRIS veteran who occasionally forgets a few basic rules (it's normal and happens to everyone!), you'll find this brief overview of IRIS basics and all its wonders useful.
Here I'd like to begin a series of articles dedicated to this topic.
There will be eight main topics in total:
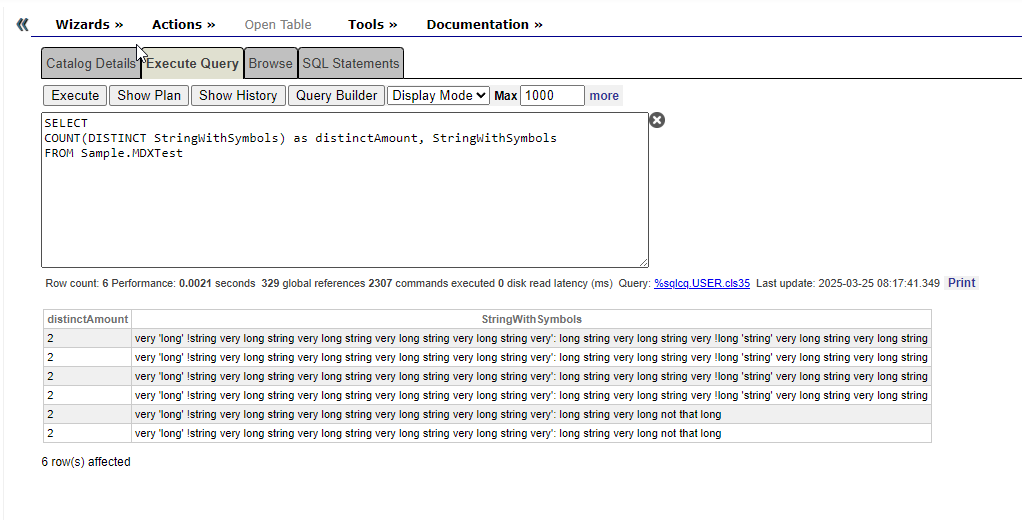
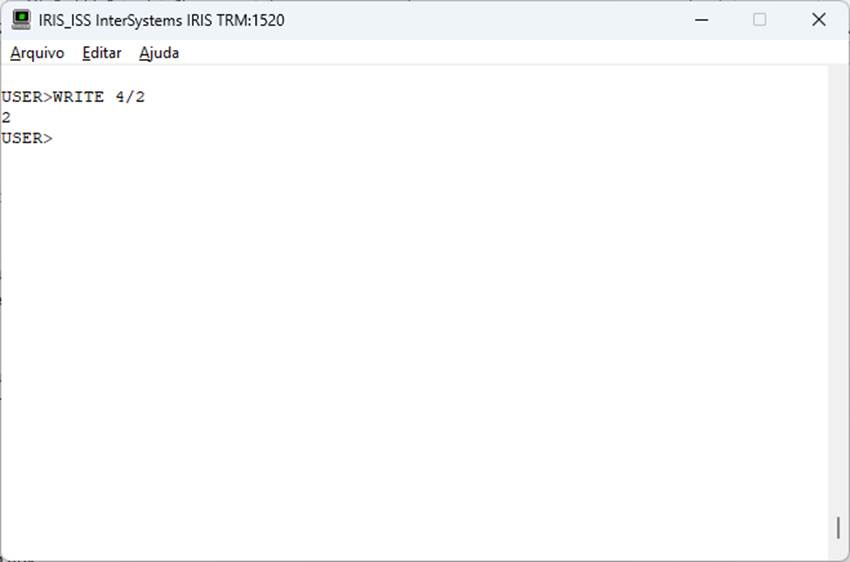
- InterSystems ObjectScript
- Build with REST APIs
- Managing Data Models
- Explore Integrated ML
- Interoperability & Integrations
- Introduction to IRIS HealthShare products
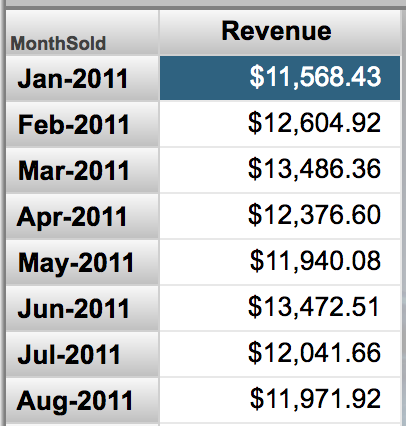
- Analytics & Business Intelligence
- Deployment & DevOps
Each of them will consist of four parts: Courses, Community articles, Documentation, Applications
This particular part will cover InterSystems ObjectScript. For your convenience, all categories will be hidden under a spoiler.

.png)