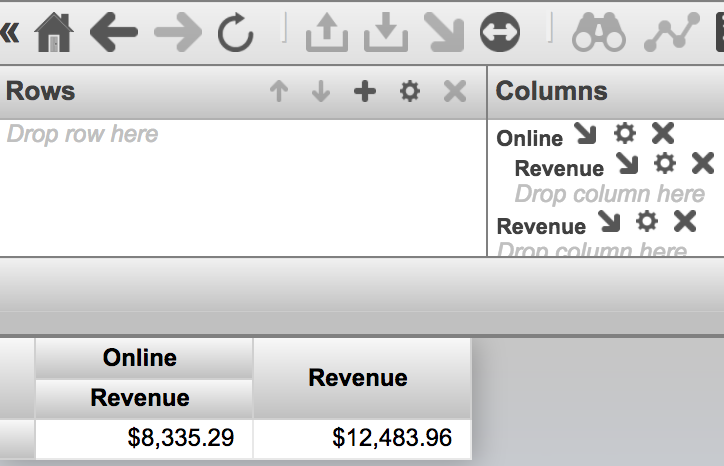
Hi all,

I recently discovered the Monitoring Activity Volume feature in IRIS and I was amazed by it. So, I put it to work in one of our productions. It is nice how easy it is to set up and all the possibilites that came with it.

But there's something weird: the numbers. Actually, one of the BP is stating a time of more than 6 seconds to process:

2 6
1 386

Hi All, We have been using DeepSee which has been the integrated Analytic Dashboard built over Cache Cubes. It works fine but it's visual capabilities are limited and most probably is getting phased out. If I am not wrong, Tableau is the suggested alternative to DeepSee . It is expensive and a big and considerable shift from existing technology I wanted to get an opinion of the community as to these few key points - What other BI tools others have been using with IRIS and what have been their experience - For which tools are the best inbuilt support / api's avaialble in IRIS

2 10
0 609

I want to have a generic PercentOfAll measure that can be used for any dimension of the cube. This PercentOfAll should act like Count, but instead of showing the number of rows in a cell, it will show the percentage (100*number of rows for that member/all rows) .It should not matter what dimension is being viewed. Ex

There are a total of 100 rows in the source class.

1 1
0 371
Question
· Aug 3, 2017
DeepSee time series - season

Hello,

I have a series of data organized by time (year and month) so I can use a time dimension to drill down data. So far so good.

However, I need to display the data not by calendar years and months but rather by seasons. The season has 12 calendar months but starts in September. So I'd like to see the data from September / Year N to August / Year N+1 using the same hierarchy as normal time dimension.

Has anyone done something similar?

Obviously, the season can start by any month, not only September :)

TIA!

1 3
0 317

I have an SDA feed from an Edge server that eventually is fed into HSHI / Analytics. This edge server is loading up patient demographics (in the Patient object), which feeds the HSAA.Patient table in HSHI / Analytics.

However, we have other edge servers also feeding into the same HSHI database, and these other edge servers have better demographic information.

1 2
0 364

Hello!

I'm trying to make a simple hello world program for iKnow but the documentation only shows examples using the scripting language or XML XData.

The domain is already created and configured, what I hope for is to be able to work with the data in some high-level language.

Is it possible to do something like this:


int domainId = 1;
IKnow iknow = new IKnow( domainId );
List concepts = iknow.getTopConcepts();

Any feedback will be greatly appreciated!

1 8
0 499

Hello!

My group and I are currently doing a research project on natural language processing and iKnow plays a big role in this project. I am aware that the algorithms iKnow use aren't public, and I respect that.

My question is, are there any public documents/research that explains, at least part of, the algorthims iKnow uses and the motivations for using them?

1 2
0 420

Hi everyone,

I'm creating something to test the Analytics capabilities.

I have a table with 100k records. Consulting the data using ^%G or SELECT, everything is working fine.

But, when I create a Cube using this same class as Source, the Build results in only 1 fact.

I would like to know if anyone else faces the same situation before and have some guidance.

Some details:

1 6
0 292

I am trying to create a query that returns the best and worst performing products for a given customer, based on this year's net sales versus last year's net sales, weighted by the total net sales for all of the products sold to this customer in the last two years.

I have created Last Year Net Sales (up to the last month end): AGGREGATE(PERIODSTODATE([Invoice Date].[H1].[YEAR],[Invoice Date].[H1].[Month].[NOW-13]),measures.[Net Sales])

0 3
0 378

Dear Folks,

I have recently studied deepsee and developed few dashboards needed for our web app users. I am trying to embed them in our existing web app which uses angular with delegated user access. I need to embed the native IRIS dashboard into it. ( I can't use Highcharts or any other js tools).

How do I setup the dashboards to work with delegated authentication (Without providing access to management portal or other parts) ? Also should I use the default csp/{Namespace}/_DeepSee.UserPortal.DashboardViewer.zen? or any other web application URL ?

Thanks

0 1
0 213
Question
· Oct 6, 2022
MDX Syntax Help

we have this container code where we want to create more CalcMember properties

<sharedCalcMember FullName="HSAAPATIENT||DEMOGRAPHICS||CITIZENSHIP.NATIONAL.sharedCalcMember" Dimension="Demographics" Name="Citizenship.National" Expression="[Demographics].[H10].[Citizenship].&amp;[USA]" SolveOrder="0" CubeName="HSAAPATIENT" UpperCaseDimension="DEMOGRAPHICS" UpperCaseName="CITIZENSHIP.NATIONAL"></sharedCalcMember>

0 3
0 231

Hi all,

we are wondering if anybody has a reporting tool that is capable using IRIS Objects?

I know there are things like Crystal Reports and others out there who can read the SQL Data throug ODBC but we need the capability of using object methods while running the report.

Since now we where using a JAVA based report generator (ReportWeaver) but since the object binding for JAVA doesn't exist anymore in IRIS data platform, did any of you have an alternative report generator?

Looking forward to any answers

cheers

Stephan

0 2
0 390

When creating pivots in DeepSee, there is the ability to group date dimensions by Day, Week, Month, Quarter, Year. For some of our reporting the Week option is desired. However the display looks like the image shown below. Notice the "YYYYW##" formatting.

Is there any ability within DeepSee to modify the display of grouped week dates? E.g. instead of 2020W14 it could be 03/30/2020-04/05-2020, or even just the start or end date, etc.

0 2
1 177

Back in my COBOL days, there was a utility that would analyze running COBOL code and expose bottle necks and those modules that were inefficient or were executed multiple times. This was to help the programmer know where to concentrate streamlining efforts.

Is there any such utility for Caché Routines?

0 4
0 411
Question
· Apr 12, 2017
Message Profiling

Hi all,

I was wondering if InterSystems offers any message profiling capabilities. What I mean by "message profiling" is essentially stats or metrics gathered from a collection of data submissions of a particular type. For instance, average number of segments <XYZ> in a specific HL7 V2 message type. Or the number of sections found in a HL7 V3 CDA documents.

Curious if there is anything like this provided "out-of-box".

Thanks!

James

0 4
0 447

We have created a custom SDA container to store a certain kind of new, customized patient data.

We are observing a behavior in the correspoding analytics table for this custom SDA class where rows are added for a patient for which the MPI is null and the patient record does not exist.

0 2
0 311

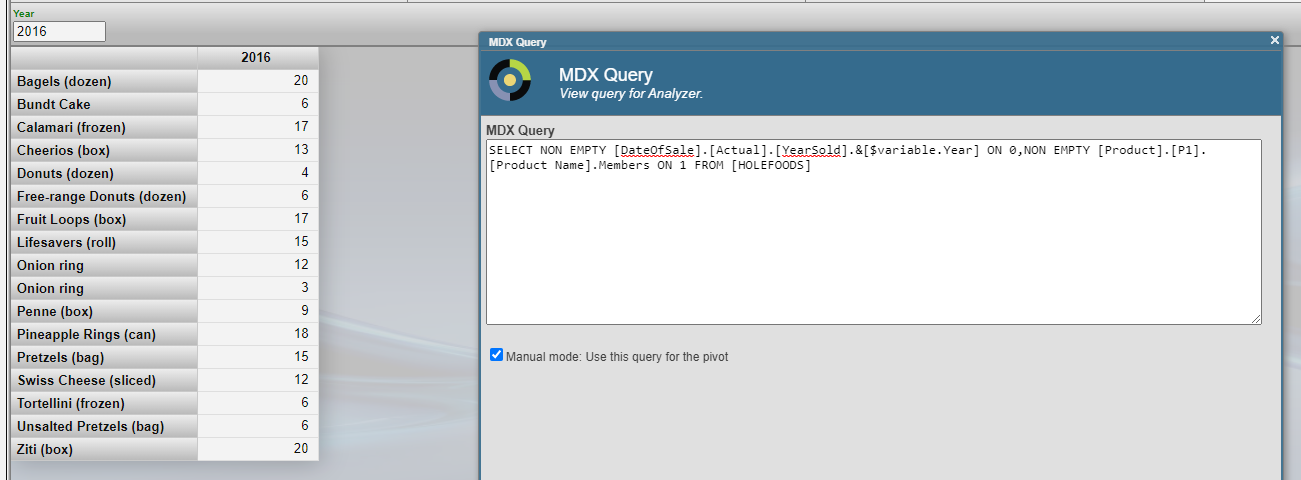
Is there a way to add/substract from a pivot variable?

I have this MDX:

SELECT
  NON EMPTY [DateOfSale].[Actual].[YearSold].&[$variable.Year] ON 0,
  NON EMPTY [Product].[P1].[Product Name].Members ON 1
FROM [HOLEFOODS]

And with pivot variable Year equal to, say, 2016 it works:

Now I want to add previous year first with one pivot variable and one explicit reference. It also works:

0 3
0 161