Using SYSMON Dashboards for monitoring the work of InterSystems Caché, Ensemble and HealthShare
System Monitor is a flexible and highly configurable tool supplied with Caché (Ensemble, HealthShare), which collects the essential metrics of the operating system and Caché itself. System Monitor also notifies administrators about issues with Caché and the operating system, when one or several parameters reach the admin-defined thresholds.
Notifications are sent by email or delivered otherwise via a custom notifications class. Notifications can be configured with the help of the ^%SYSMONMGR tool. For email delivery, the admin needs to to specify the parameters of the email server, the recipient’s email address and authentication settings. After that, the user can add the required addresses to the delivery list and test the settings by sending a test message. Once done, the tool will send email notifications about the remaining hard drive space, license expiry information and more. Additional information about notifications can be found here.
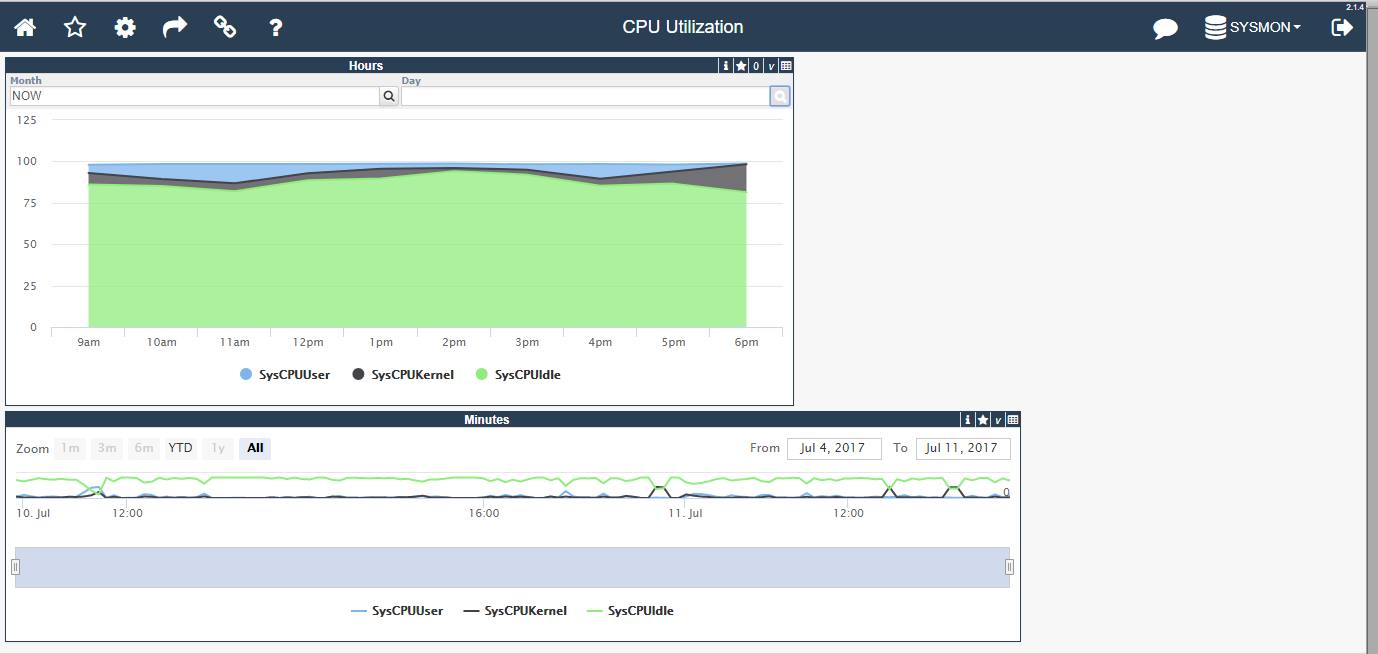
Immediately after startup (by default, the tool is launched along with a Caché instance), System Monitor starts collecting metrics and recording them to system tables. Collected data is available via SQL. Besides, you can use SYSMON Dashboards to view and analyze these metrics starting from version 2015.1.
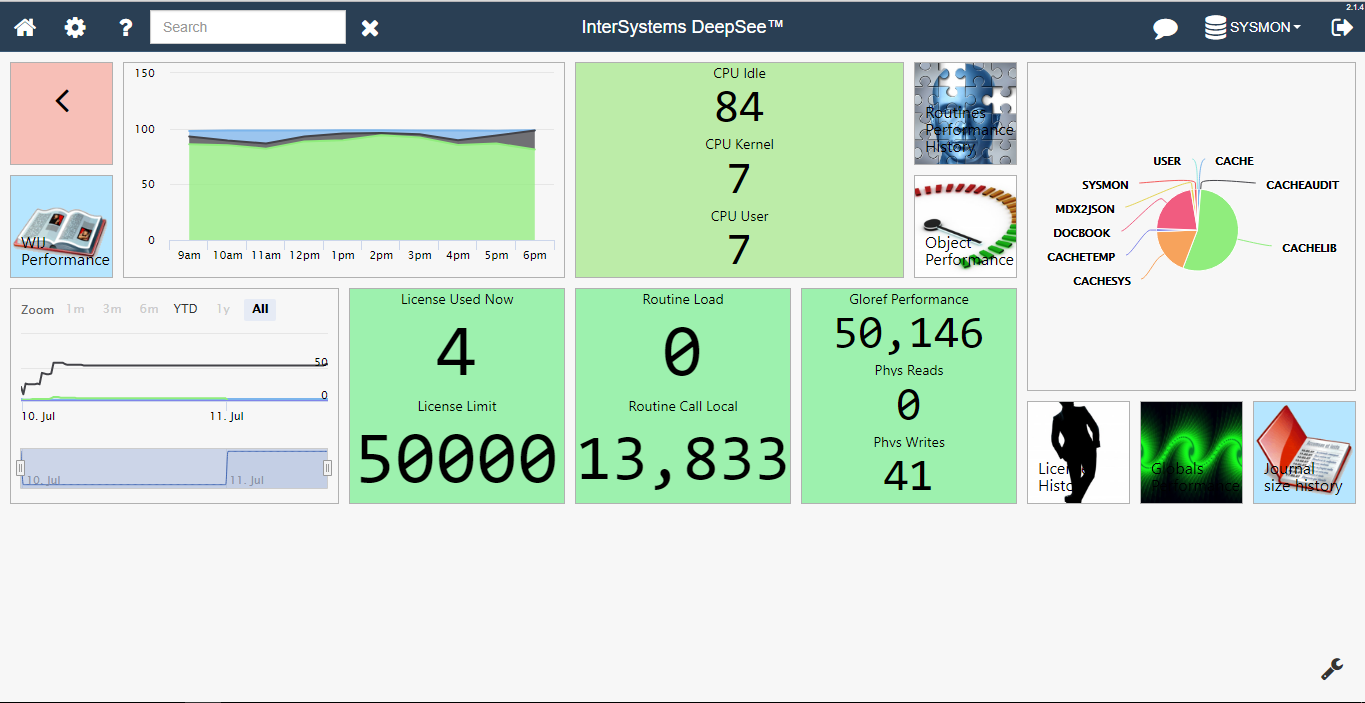
SYSMON Dashboards is an open-source project for viewing and analyzing metrics. The project is supplied with a set of analytical dashboards featuring graphs for OS and Caché parameters. SYSMON Dashboards uses the DeepSee technology for analytics and building analytical dashboards. The installation process is fairly simple. Here’s what you need to do:
- Download the latest release,
- Import the class to any space (for example, USER),
- Start the installation using the following command:
do ##class(kutac.monitor.utils.Installer).setup().All other settings will be configured automatically. After installation, the DeepSee portal will get a set of DeepSee toolbars for viewing and analyzing performance metrics.
In order to view DeepSee toolbars, I use DeepSeeWeb, an open-source project that uses an extended set of components for visualizing DeepSee analytical panels.
SYSMON Dashboards also includes a web interface for configuring the monitor and notifications. For detailed configuration, I recommend using the ^%SYSMONMGR utility. The SYSMON Dashboards settings page helps monitor a set of metrics, as well as to start/stop the monitor.

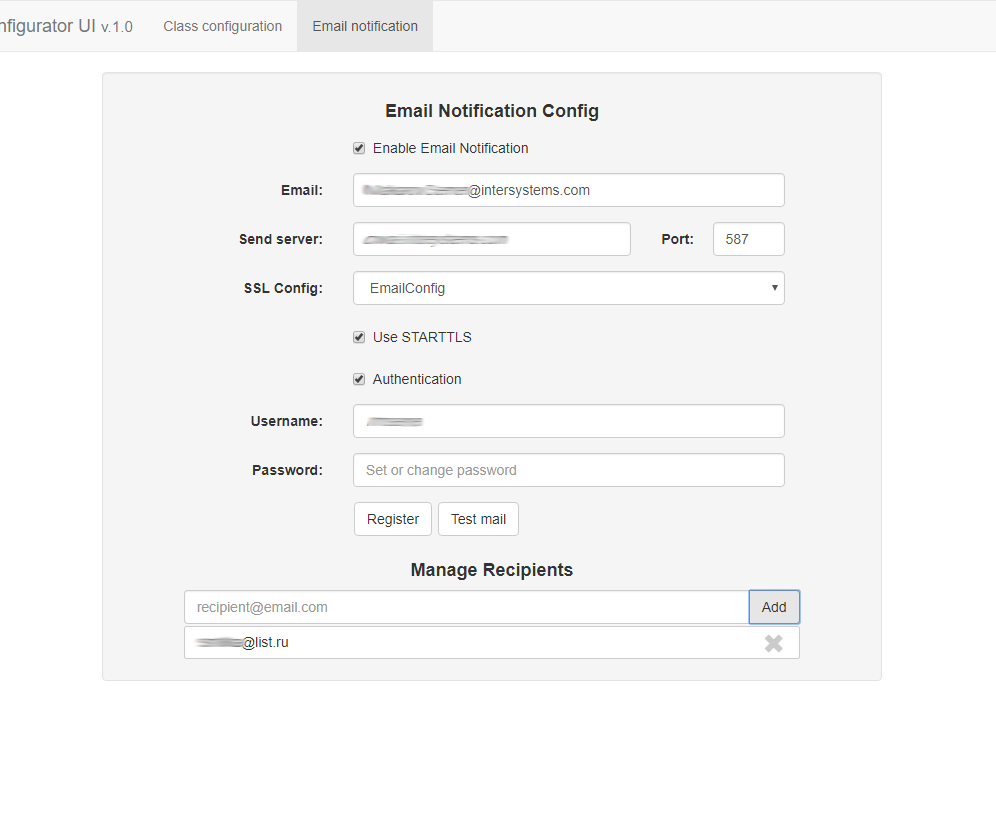
Configuration of Email notification settings via the web interface is no different than the standard process: you need to specify the server parameters, address and authentication details.
Example of email settings configuration:
This way, by using the standard Caché tool, SYSMON Dashboards and DeepSeeWeb, you can considerably simplify the task of monitoring InterSystems platforms.
Comments
Thanks Semion. I downloaded and installed SYSMON dashboards on a development server but I can't find the SYSMON Configurator tool you're mentioning and showing. Where is that located?
Sorry for waiting. Go to URL: "{yourserver:port}/csp/sysmon/index.html".