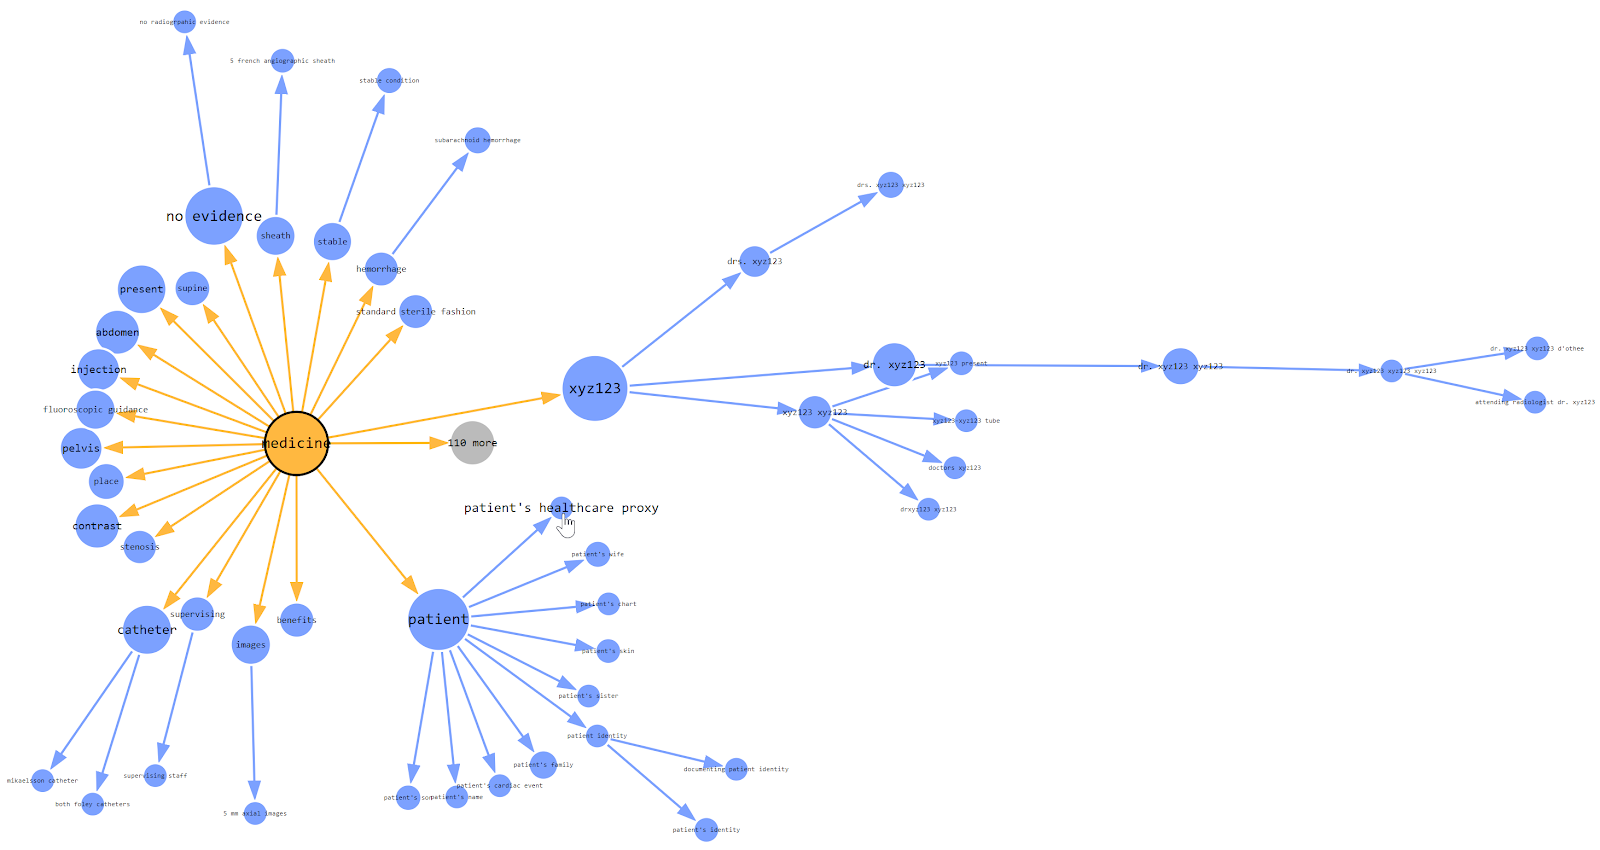
The invention and popularization of Large Language Models (such as OpenAI's GPT-4) has launched a wave of innovative solutions that can leverage large volumes of unstructured data that was impractical or even impossible to process manually until recently.

27 4
5 589

Hi colleagues!

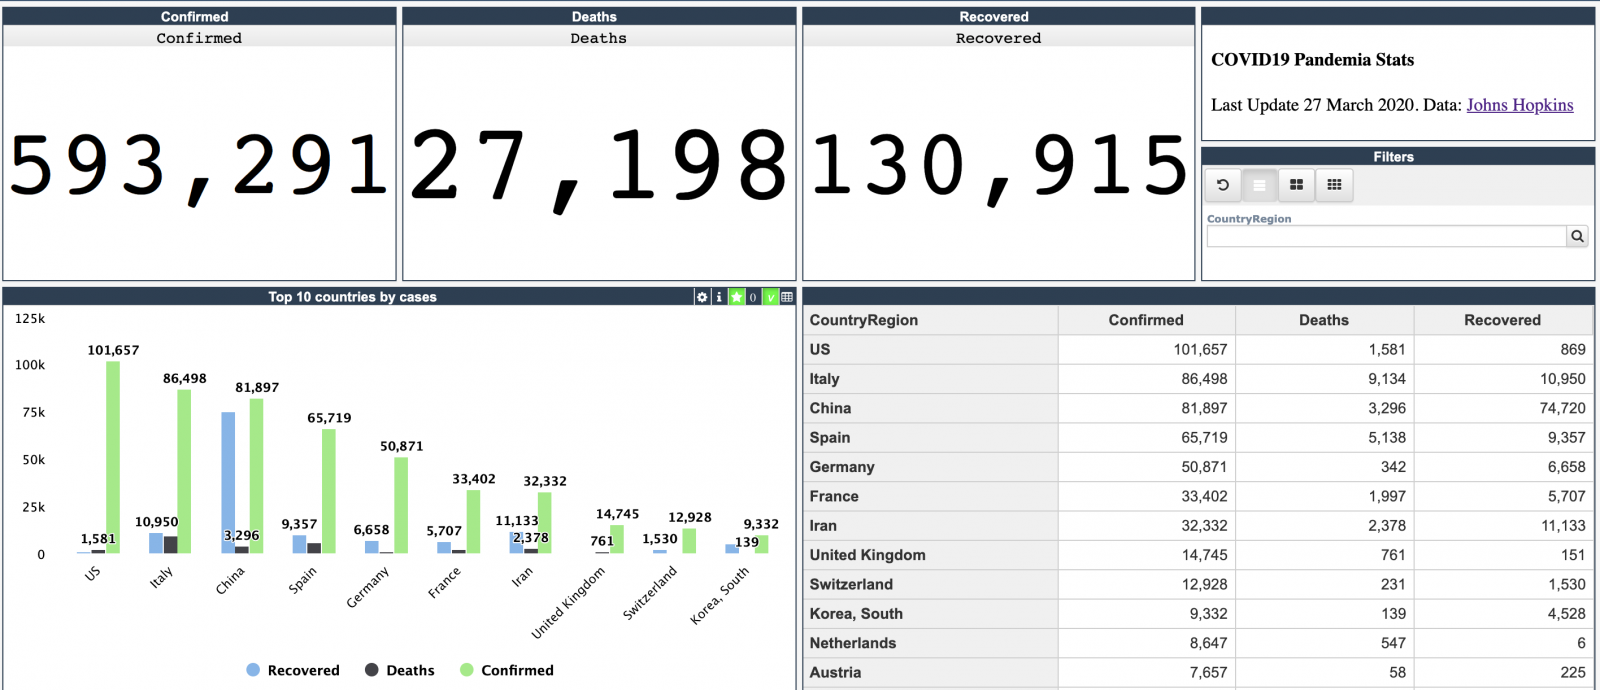
Every day Johns Hopkins University publishes new data on coronavirus COVID-19 pandemic status.

I built a simple InterSystems IRIS Analytics dashboard using InterSystems IRIS Community Edition in docker deployed on GCP Kubernetes which shows key measures of the disease outbreak.

This dashboard is an example of how information from CSV could be analyzed with IRIS Analytics and deployed to GCP Kubernetes in a form of InterSystems IRIS Community Edition.

Added the interactive map of the USA:

19 13
3 986
Article
· Feb 13, 2023 4m read
When to use Columnar Storage

With InterSystems IRIS 2022.2, we introduced Columnar Storage as a new option for persisting your IRIS SQL tables that can boost your analytical queries by an order of magnitude. The capability is marked as experimental in 2022.2 and 2022.3, but will "graduate" to a fully supported production capability in the upcoming 2023.1 release.

The product documentation and this introductory video, already describe the differences between row storage, still the default on IRIS and used throughout our customer base, and columnar table storage and provide high-level guidance on choosing the appropriate storage layout for your use case. In this article, we'll elaborate on this subject and share some recommendations based on industry-practice modelling principles, internal testing, and feedback from Early Access Program participants.

14 2
2 560

Last week, we announced the InterSystems IRIS Data Platform, our new and comprehensive platform for all your data endeavours, whether transactional, analytics or both. We've included many of the features our customers know and loved from Caché and Ensemble, but in this article we'll shed a little more light on one of the new capabilities of the platform: SQL Sharding, a powerful new feature in our scalability story.

13 11
1 1.5K

Apache Spark has rapidly become one of the most exciting technologies for big data analytics and machine learning. Spark is a general data processing engine created for use in clustered computing environments. Its heart is the Resilient Distributed Dataset (RDD) which represents a distributed, fault tolerant, collection of data that can be operated on in parallel across the nodes of a cluster. Spark is implemented using a combination of Java and Scala and so comes as a library that can run on any JVM.

11 5
1 2.6K

Over the last couple of weeks the Solution Architecture team has been working to finish off our 2019 workload: this included open-sourcing the Readmission Demo that was brought to HIMSS last year, so we could make it available to anyone looking for an interactive-way of exploring the tooling provided by IRIS.

11 2
1 1.2K

In today's data landscape, businesses encounter a number of different challenges. One of them is to do analytics on top of unified and harmonized data layer available to all the consumers. A layer that can deliver the same answers to the same questions irrelative to the dialect or tool being used.

11 2
1 343
Article
· May 11, 2021 8m read
IRIS in Astronomy

In this article we are going to show the results of the comparision between IRIS and Postgress when handling Astronomy data.

Introduction

Since the earliest days of human civilization we have been fascinated by the sky at night. There are so many stars! Everybody has dreamed about them and fantasized about life in other planets.

10 7
0 696

In this article you will have access to the curated base of articles from the InterSystems Developer Community of the most relevant topics to learning InterSystems IRIS. Find top published articles ranked by Machine Learning, Embedded Python, JSON, API and REST Applications, Manage and Configure InterSystems Environments, Docker and Cloud, VSCode, SQL, Analytics/BI, Globals, Security, DevOps, Interoperability, Native API. Learn and Enjoy!

10 6
7 922
Announcement
· Mar 15, 2021
FHIR Analytics

Hi developers,

We have received quite a lot of interest in using SQL on FHIR data. As you know, FHIR data is encoded in the form of a complex directed graph, and thus you can not easily query it with traditional SQL queries or business intelligence tools. Some customers have noticed that the "FHIR search tables" in IRIS for Health have flattened part of the FHIR graph, and have tried to use them for analytics. This is an undocumented and unsupported part of IRIS for Health, and can change without notice.

10 1
0 383

In an ever-changing world, companies must innovate to stay competitive. This ensures that they’ll make decisions with agility and safety, aiming for future results with greater accuracy.
Business Intelligence (BI) tools help companies make intelligent decisions instead of relying on trial and error. These intelligent decisions can make the difference between success and failure in the marketplace.
Microsoft Power BI is one of the industry’s leading business intelligence tools. With just a few clicks, Power BI makes it easy for managers and analysts to explore a company’s data. This is important because when data is easy to access and visualize, it’s much more like it’ll be used to make business decisions.


9 9
2 2.7K

Preview releases are now available for InterSystems IRIS Advanced Analytics, and InterSystems IRIS for Health Advanced Analytics! The Advanced Analytics add-on for InterSystems IRIS introduces IntegratedML as a key new feature.

9 1
3 611

Hey Developers,

This week is a voting week for the InterSystems Analytics Contest! So, it's time to give your vote to the best solutions built with InterSystems IRIS.

🔥 You decide: VOTING IS HERE 🔥

How to vote?

Please meet the new voting engine and algorithm for the Experts and Community nomination:

8 3
0 279

Creating information dashboards, pivot tables, and widgets is an important step in analysis that provides valuable sources of information for informed decision-making. The IRIS BI platform offers many opportunities to create and customize these elements. In this article, we will take a closer look at the basic techniques for developing them and the importance of using them.

7 1
0 404

This year's Virtual Summit has more content around Analytics and AI than ever before. We've made this quick video to guide you through the program and put things into context with respect to InterSystems overall strategy for Data & Analytics.

https://www.youtube.com/embed/fTcNimWi2y0
[This is an embedded link, but you cannot view embedded content directly on the site because you have declined the cookies necessary to access it. To view embedded content, you would need to accept all cookies in your Cookies Settings]

6 0
0 258
Article
· May 25, 2017 2m read
The Interns are Coming!

The Data Platforms department here at InterSystems is gearing up for this year's crop of interns, and I for one am very excited to meet them all next week!

We've got folks from top technical colleges with diverse specialties from hard core engineers to pure computer scientists to mathematicians to business professionals. They come from countries around the world like Vietnam, China, and Finland and they all come with impressive backgrounds. We're sure they will do very well this summer.

6 0
0 497

Why log in to view pivot tables when you can have them delivered directly to your inbox? Are you in need of automated reporting for InterSystems IRIS Business Intelligence? Pivot Subscriptions is your solution: a tool for subscribing to scheduled email reports of pivot tables inside InterSystems IRIS Business Intelligence (previously known as DeepSee).

6 0
1 511

The OKR methodology (Objectives and Key Results or Objectives and Key Results) is used by the largest companies in the world (such as Google, Netflix, Spotify, BMW, Linkedin, etc.) for agile performance management. It was created in the 1970s by Andrew Grove, president of Intel, and introduced to the general public in his famous book “High Output Management”.

Around 1998 John Doerr, one of the world's top venture capitalists, after coming into contact with Intel's OKR, introduced the model to Larry Page and Sergey Brin, who started a small company called Google.

6 0
1 242

Hi Community,

We're pleased to invite you to the online meetup with the winners of the InterSystems Analytics Contest!

Date & Time: Monday, January 4, 2021 – 10:00 EDT

What awaits you at this virtual Meetup?

  • Our winners' bios.
  • Short demos on their applications.
  • An open discussion about technologies being used, bonuses, questions. Plans for the next contests.

6 3
0 371
Article
· Apr 19, 2023 2m read
Apache Superset now with IRIS

Apache Superset is a modern data exploration and data visualization platform. Superset can replace or augment proprietary business intelligence tools for many teams. Superset integrates well with a variety of data sources.

And now it is possible to use with InterSystems IRIS as well.

An online demo is available and it uses IRIS Cloud SQL as a data source.

6 4
0 729
Announcement
· May 21, 2018
How is your code health

As a developer, usually I'm concerned about how my code health is, and how the other coders code can affect to my own work. And I'm quite sure most of us feel very similar.

In our company we use a Static Code Analysis tool to analyze code for different languages to ensure we are writing high quality and easily maintainable code by following a few best practices in terms of code structure and content. And the question was: why should be different for Caché ObjectScript language?

6 3
4 1.1K

How are we doing THIS year versus the same period LAST year?
This is a common need in Business Intelligence. In fact, many design specifications for reports make use of a comparison between a selected period (year, quarter, etc) up to a certain date (for example November 15th, 2016) and a summary of the same information for the previous year (i.e. up to November 15th, 2015).
This post shows how to implement this in DeepSee.

6 8
0 1.8K

AnalyzeThis is a tool for getting a personalized preview of your own data inside of InterSystems BI. This allows you to get first hand experience with InterSystems BI and understand the power and value it can bring to your organization. In addition to getting a personalized preview of InterSystems BI through an import of a CSV file with your data, Classes and SQL Queries are now supported as Data Sources in v1.1.0!

6 4
0 576