Hi everyone! 👋
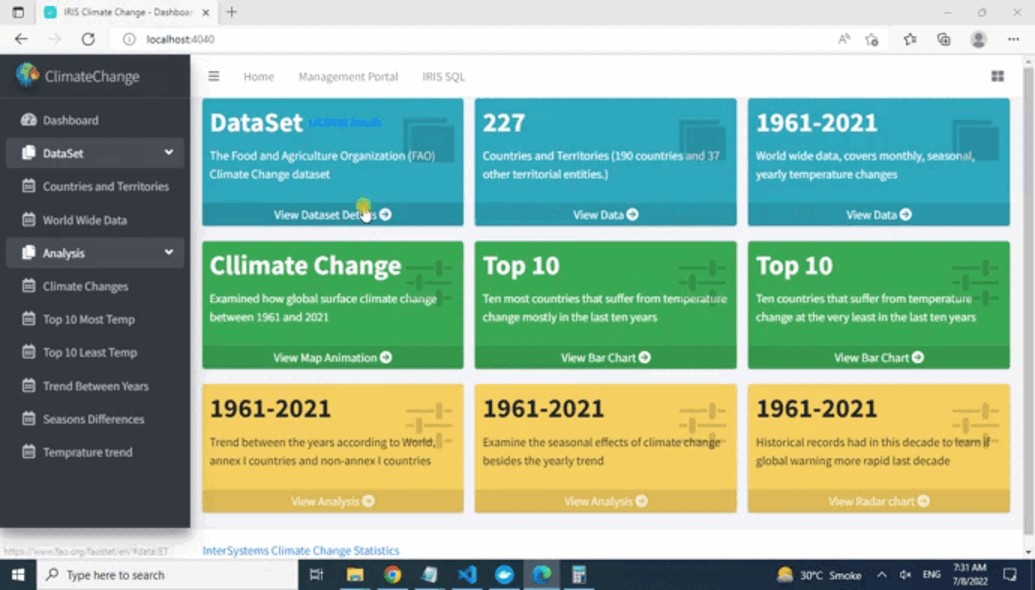
I’m excited to share the project I’ve submitted to the current InterSystems .Net, Java, Python, and JavaScript Contest — it’s called IRIStool and Data Manager, and you can find it on the InterSystems Open Exchange and on my GitHub page.
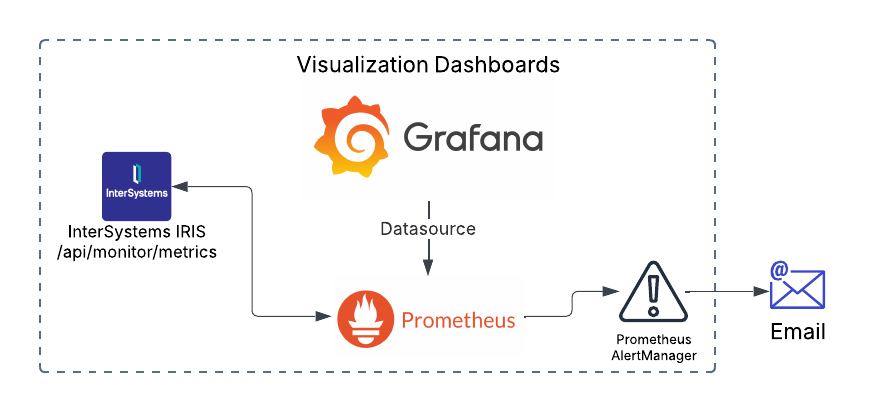
Visualization refers to the techniques used to communicate data or information by encoding it as visual objects (e.g., points, lines or bars) contained in graphics. The goal is to communicate information clearly and efficiently to users.
.png)
 Hello!
.png)

.png)
