There are several options how to deliver user interface(UI) for DeepSee BI solutions. The most common approaches are:

  • use native DeepSee Dashboards, get web UI in Zen and deliver it in your web apps.
  • use DeepSee REST API, get and build your own UI widgets and dashboards.

The 1st approach is good because of the possibility to build BI dashboards without coding relatively fast, but you are limited with preset widgets library which is expandable but with a lot of development efforts.

The 2nd provides you the way to use any comprehensive js framework (D3, Highcharts, etc) to visualize your DeepSee data, but you need to code widgets and dashboards on your own.

Today I want to tell you about yet another approach which combines both listed above and provides Angular based web UI for DeepSee Dashboards - DeepSee Web library.

3 16
5 2.1K

Hi colleagues!

Every day Johns Hopkins University publishes new data on coronavirus COVID-19 pandemic status.

I built a simple InterSystems IRIS Analytics dashboard using InterSystems IRIS Community Edition in docker deployed on GCP Kubernetes which shows key measures of the disease outbreak.

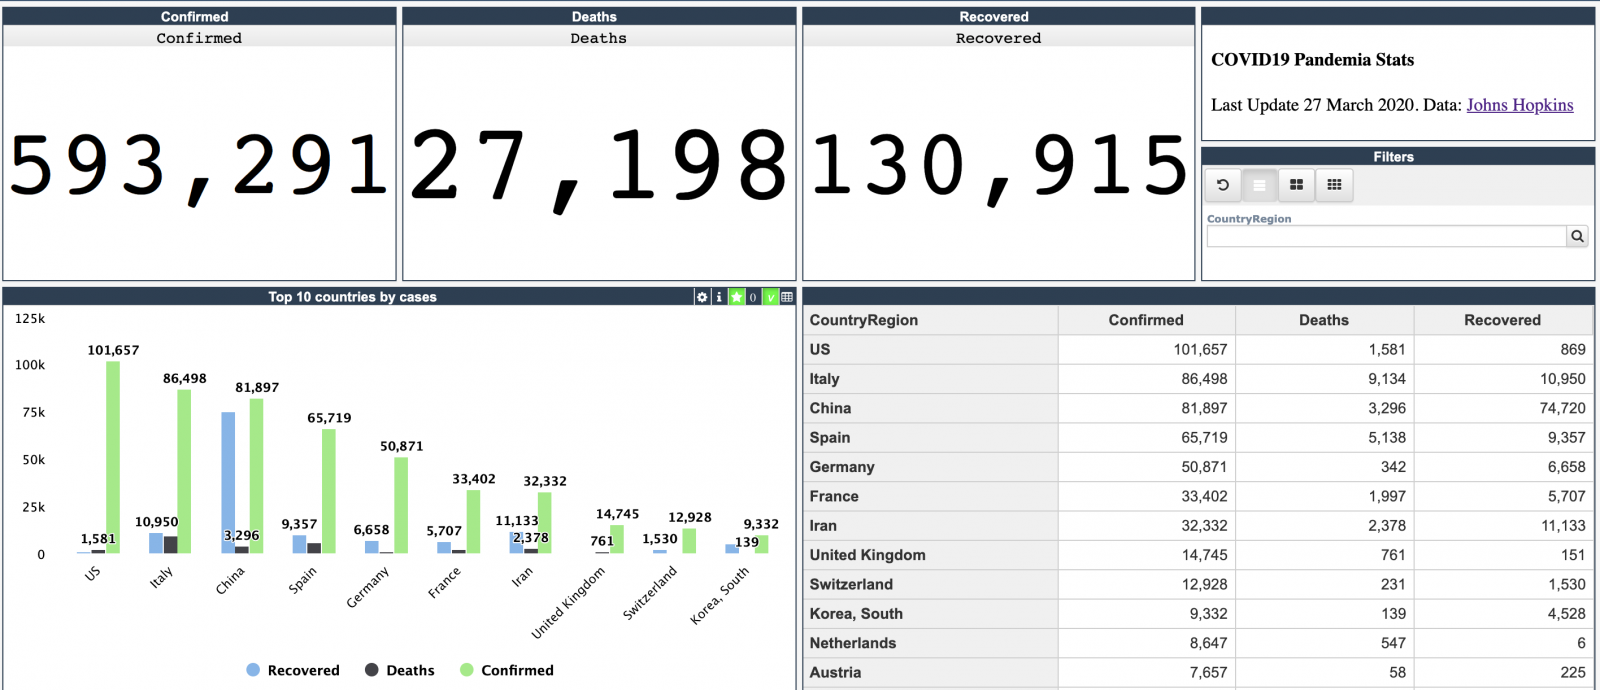
This dashboard is an example of how information from CSV could be analyzed with IRIS Analytics and deployed to GCP Kubernetes in a form of InterSystems IRIS Community Edition.

Added the interactive map of the USA:

19 13
3 948

This is my introduction to a series of posts explaining how to create an end-to-end Machine Learning system.

Starting with one problem

Our IRIS Development Community has several posts without tags or wrong tagged. As the posts keep growing the organization
of each tag and the experience of any community member browsing the subjects tends to decrease.

First solutions in mind

We can think some usual solutions for this scenario, like:

5 11
2 408

Last week, we announced the InterSystems IRIS Data Platform, our new and comprehensive platform for all your data endeavours, whether transactional, analytics or both. We've included many of the features our customers know and loved from Caché and Ensemble, but in this article we'll shed a little more light on one of the new capabilities of the platform: SQL Sharding, a powerful new feature in our scalability story.

13 11
1 1.5K

In an ever-changing world, companies must innovate to stay competitive. This ensures that they’ll make decisions with agility and safety, aiming for future results with greater accuracy.
Business Intelligence (BI) tools help companies make intelligent decisions instead of relying on trial and error. These intelligent decisions can make the difference between success and failure in the marketplace.
Microsoft Power BI is one of the industry’s leading business intelligence tools. With just a few clicks, Power BI makes it easy for managers and analysts to explore a company’s data. This is important because when data is easy to access and visualize, it’s much more like it’ll be used to make business decisions.


9 9
2 2.6K

How are we doing THIS year versus the same period LAST year?
This is a common need in Business Intelligence. In fact, many design specifications for reports make use of a comparison between a selected period (year, quarter, etc) up to a certain date (for example November 15th, 2016) and a summary of the same information for the previous year (i.e. up to November 15th, 2015).
This post shows how to implement this in DeepSee.

6 8
0 1.7K
Article
· May 11, 2021 8m read
IRIS in Astronomy

In this article we are going to show the results of the comparision between IRIS and Postgress when handling Astronomy data.

Introduction

Since the earliest days of human civilization we have been fascinated by the sky at night. There are so many stars! Everybody has dreamed about them and fantasized about life in other planets.

10 7
0 637

In this article you will have access to the curated base of articles from the InterSystems Developer Community of the most relevant topics to learning InterSystems IRIS. Find top published articles ranked by Machine Learning, Embedded Python, JSON, API and REST Applications, Manage and Configure InterSystems Environments, Docker and Cloud, VSCode, SQL, Analytics/BI, Globals, Security, DevOps, Interoperability, Native API. Learn and Enjoy!

10 6
7 884

The following post outlines an architectural design of intermediate complexity for DeepSee. As in the previous example, this implementation includes separate databases for storing the DeepSee cache, DeepSee implementation and settings. This post introduces two new databases: the first to store the globals needed for synchronization, the second to store fact tables and indices.

5 5
0 685
Article
· Aug 2, 2020 1m read
Application Errors Analytics

Hi Developers!

As you know the application errors live in ^ERRORS global. They appear there if you call:

d e.Log() 

in a Catch section of Try-Catch.

With @Robert Cemper's approach, you can now use SQL to examine it.

Inspired by Robert's module I introduced a simple IRIS Analytics module which shows these errors in a dashboard:

3 5
1 297

Apache Spark has rapidly become one of the most exciting technologies for big data analytics and machine learning. Spark is a general data processing engine created for use in clustered computing environments. Its heart is the Resilient Distributed Dataset (RDD) which represents a distributed, fault tolerant, collection of data that can be operated on in parallel across the nodes of a cluster. Spark is implemented using a combination of Java and Scala and so comes as a library that can run on any JVM.

11 5
1 2.6K

Hi guys.

Recently, I get interest in FHIR in order to run for the IRIS for Health FHIR
contest
. As a beginner on this topic, I've heard somewhat about it, but I didn't know how complex and powerful was FHIR. As pointed out by @Henrique.GonçalvesDias here, you can model several aspects of the patient history and other related entities.

4 5
0 296

The pandemic that struck the world in 2020 made everyone follow the news and the numbers that involve the COVID-19.

Why don’t you take that opportunity to create something simple and pleasant, to follow the number of vaccinations worldwide?

To face this challenge, I'm using the data provided by Our World in Data - Research and data to make progress against the world’s largest problems.

They have a dedicated repository on Github with the data of COVID-19, and I took the vaccination data to help me with my tracker.

4 4
0 329
Article
· Oct 19, 2022 3m read
Ingestion and Querying Speed Test

The capacity of taking numerous records every second while also facilitating real-time queries simultaneously in real time is called Hybrid Transactional Analytical Processing (HTAP). It is also called Transactional analytics or Transanalytics or Translytics and is a very useful element in scenarios where there is constant flow of real time data coming from IIOT sensors or data on fluctuations in stock market, and supporting the need for querying these data sets in real-time or near real-time.

4 4
0 740

AnalyzeThis is a tool for getting a personalized preview of your own data inside of InterSystems BI. This allows you to get first hand experience with InterSystems BI and understand the power and value it can bring to your organization. In addition to getting a personalized preview of InterSystems BI through an import of a CSV file with your data, Classes and SQL Queries are now supported as Data Sources in v1.1.0!

6 4
0 560

The InterSystems IRIS has a very nice container class to allows you have your Dashboards as classes source code. It is %DeepSee.UserLibrary.Container.

With this class is possible group all your dashboard and pivot table definitions.

This is useful to automatically create your dashboards when you build your docker project and other automation scenarios.

See:

2 4
1 217
Article
· Apr 19, 2023 2m read
Apache Superset now with IRIS

Apache Superset is a modern data exploration and data visualization platform. Superset can replace or augment proprietary business intelligence tools for many teams. Superset integrates well with a variety of data sources.

And now it is possible to use with InterSystems IRIS as well.

An online demo is available and it uses IRIS Cloud SQL as a data source.

6 4
0 608
Article
· Nov 19, 2020 6m read
OCR and NLP together into InterSystems IRIS

According to IDC, more than 80% of information it is NoSQL, especially text into documents. When the digital services or applications not process all this information, the business lose. To face this challenge, it is possible use OCR technology. OCR uses machine learning and/or trained image patterns to transform image pixels into text. This is important, because many documents are scanned into images inside PDF, or many documents contains images with text inside. So OCR are an important step to get all possible data from a document.

4 3
2 447

Today, is important analyze the content into portals and websites to get informed, analyze the concorrents, analyze trends, the richness and scope of content of websites. To do this, you can alocate people to read thousand of pages and spend much money or use a crawler to extract website content and execute NLP on it. You will get all necessary insights to analyze and make precise decisions in a few minutes.

3 3
3 283
Article
· Jul 4, 2023 2m read
IntegratedMLandDashboardSample

A simple data analysis example created in IntegratedML and Dashboard

Based on InterSystems' Integrated ML technology and Dashboard, automatically generate relevant predictions and BI pages based on uploaded CSV files. The front and back ends are completed in Vue and Iris, allowing users to generate their desired data prediction and analysis pages with simple operations and make decisions based on them.

# ZPM installation

zpm:USER>install IntegratedMLandDashboardSample

# Process Deployment

3 2
0 180