Application Errors Analytics
Hi Developers!
As you know the application errors live in ^ERRORS global. They appear there if you call:
d e.Log() in a Catch section of Try-Catch.
With @Robert Cemper's approach, you can now use SQL to examine it.
Inspired by Robert's module I introduced a simple IRIS Analytics module which shows these errors in a dashboard:

And you can drill to lines if click on the charts:
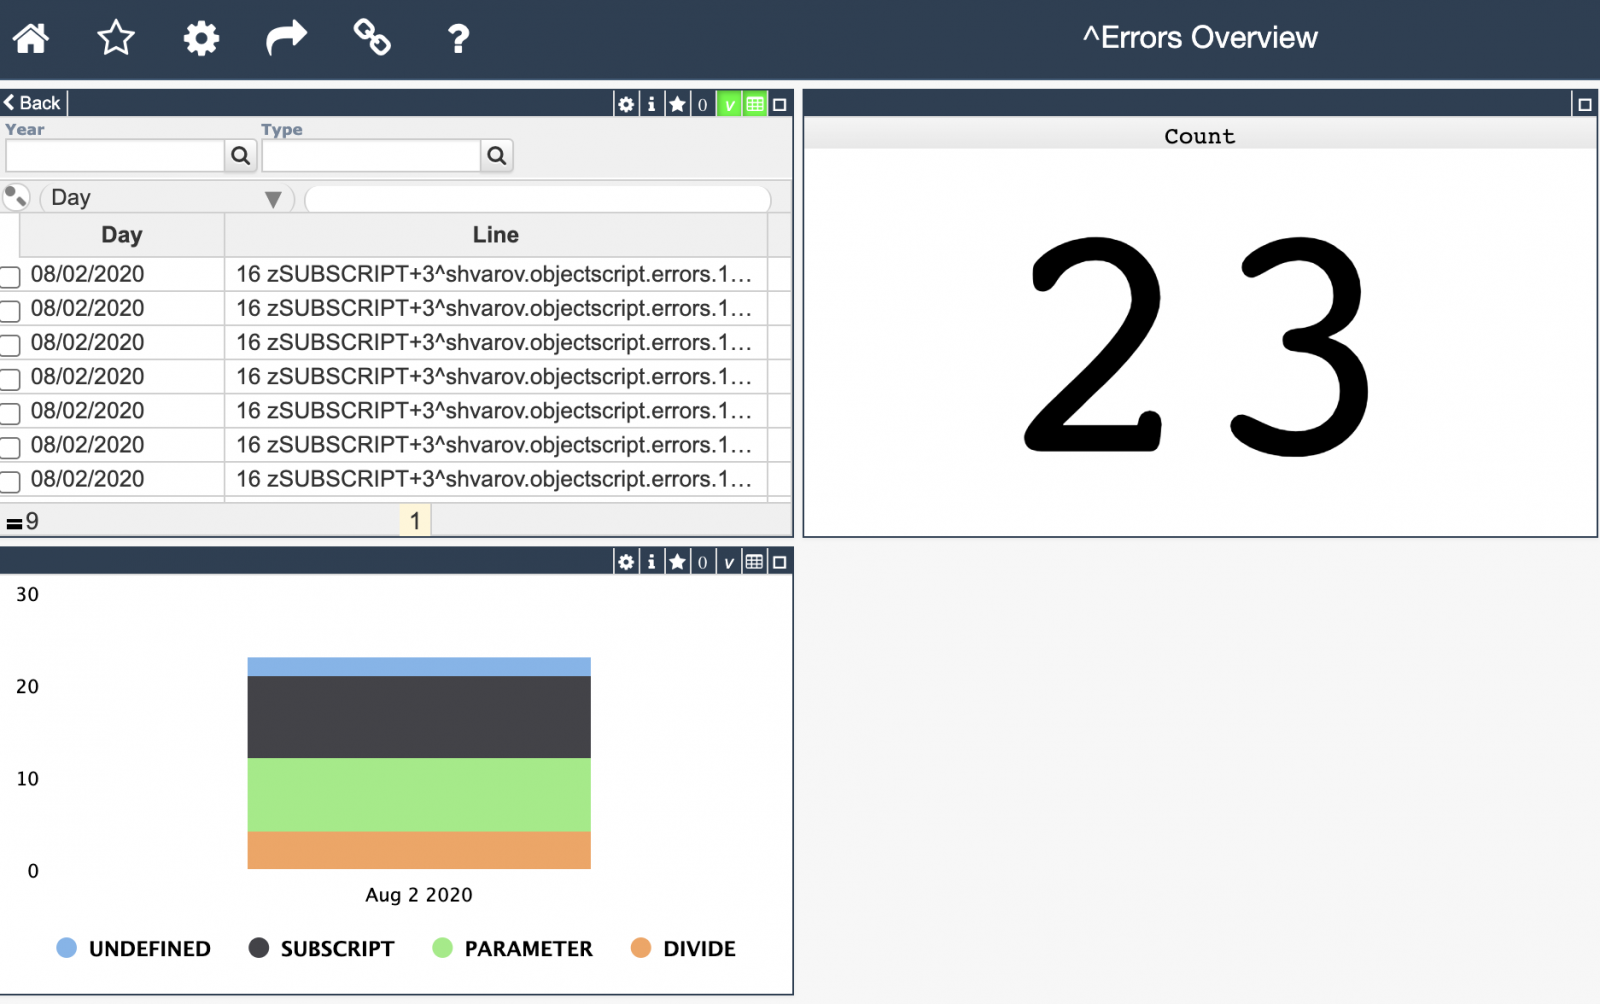
How to use it?
You can install the module with the following ZPM command:
USER>zpm "install objectscript-errors-analytics"
If you have errors in this namespace (e.g. in USER) you can check the dashboard in browser:
http://localhost:yourport/dsw/index.html#!/d/Errors/Overview.dashboard?ns=USER
And you can generate some random errors with the following command:
do ##class(shvarov.objectscript.errors.analytics.setup).GenerateErrors()
And to refresh the data and rebuild the cube:
do ##class(shvarov.objectscript.errors.analytics.setup).Run()
What is cool about this project, that it uses a new feature of 0.2.5 ZPM version to deploy IRIS Analytics resources.
Looking for your feedback and collaboration!
Comments
@Evgeny Shvarov GREAT ! I had never expected this practical value!
Our community works) And collaboration ;) And the curiosity too )
And this was a perfect case to test the new ZPM feature ;)
I think chart by the error origin would be interesting.
Could you provide an example? and what do you mean by origin?
The line of code which generated the error.
You can also translate the line of int code back into cls using this snippet.