This tag relates to the discussions on the development of analytics and business intelligence solutions, visualization, KPI and other business metrics management.
I have a persistent class “sp.SensorReading” which has a number of Properties: Date, SensorName, SensorReading. (sometimes multiple readings from the same sensor, on a given day)
... Temp 28 Jan 33.5 Temp 29 Jan 31.2 Temp 30 Jan 33.1 Temp 30 Jan 34.1 Temp 31 Jan 32.1 Temp 31 Jan 33.1
Hi All,
We have been using DeepSee which has been the integrated Analytic Dashboard built over Cache Cubes. It works fine but it's visual capabilities are limited and most probably is getting phased out.
If I am not wrong, Tableau is the suggested alternative to DeepSee . It is expensive and a big and considerable shift from existing technology
I wanted to get an opinion of the community as to these few key points
- What other BI tools others have been using with IRIS and what have been their experience
- For which tools are the best inbuilt support / api's avaialble in IRIS
Hi there, We need your help, in the build pivot with DMX, we don't can run the pivot. The MDX use is:
WITH MEMBER [Measures].[CondicionesContCompleta] AS ( IIf([Measures].[CondicionesContCompleta] = Null, 0,[Measures].[CondicionesContCompleta] ) ) SELECT NON EMPTY ( [Gerencia].Gerencia].[Gerencia] ) ON ROWS, NON EMPTY ( [Measures].[CondicionesContCompleta] ) ON COLUMNS FROM [Condiciones]
and when we executed the pivot display the next dialog.
Error#5001: Expected operator within tuple: ('SELECT' @pos 156)(2)
Hi, it is possible to convert a csv file to json file?
I want to stream json files and output the data as it comes in from the files. So my files are "csv" type and I want to convert these files to "json" type.
I recently discovered the Monitoring Activity Volume feature in IRIS and I was amazed by it. So, I put it to work in one of our productions. It is nice how easy it is to set up and all the possibilites that came with it.
But there's something weird: the numbers. Actually, one of the BP is stating a time of more than 6 seconds to process:
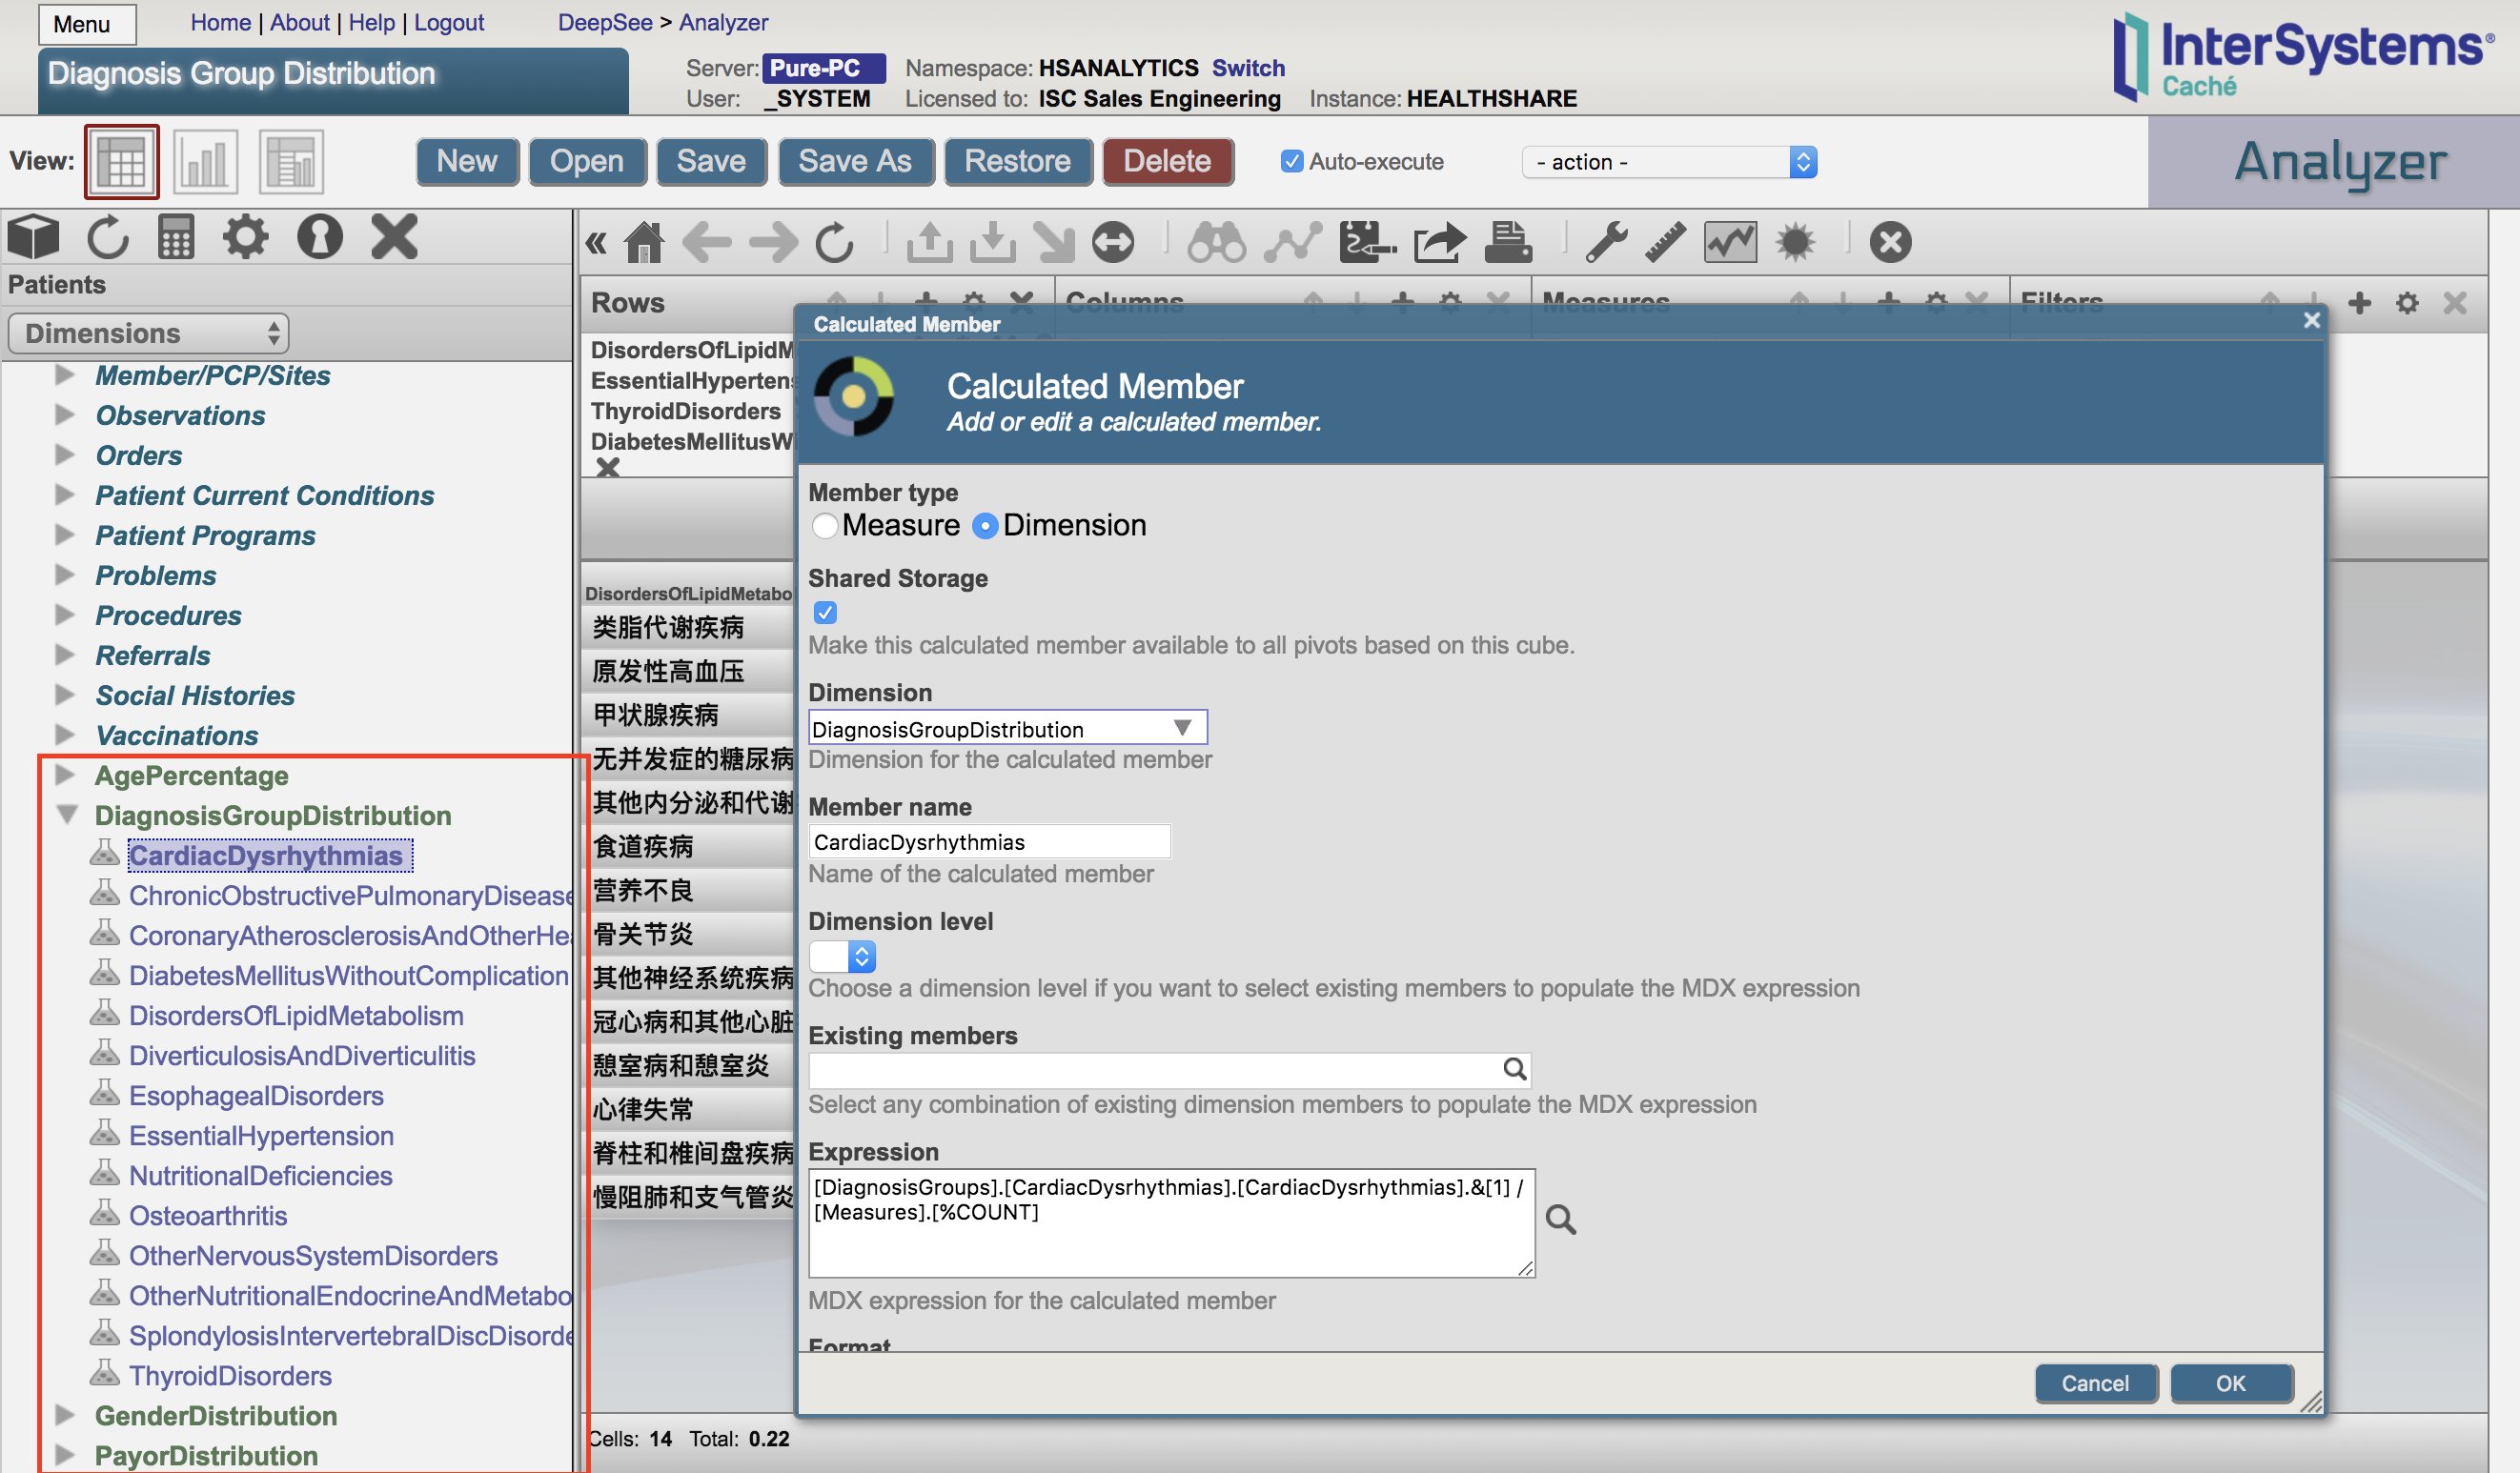
I'm trying to immigrate some of my HealthInsight dashboards and pivot tables to another HS instance.
In some pivot tables, I defined them with a set of calculated dimensions defined in the analyzer, e.g as below:
Then when I exported the cubes and pivot tables in used to my new envirmonment. When I open my pivot tables again, the calculated dimensions are missing and hence my pivot tables no longer work:
I have a server with rusw locale but in my cube the time dimension shows dates such as "JAN-2018". Is there a way to either localize that (preferably) or just output numbers like "01-2018"?
Architect:
Analyzer:
Also in architect, in level settings there is a "Time Format" property, what's that? Tried setting it to 3 but it didn't help.
I like to validate some use cases and have the following question. I am relatively new to IRIS. Perhaps someone can help:
1. I have a global m[x,y,z,f] distributed across multiple sharded instances 2. I know that i can set assign computed SQL expressions to class variables using Objectscript 3. Is there a possibility in Globals API to do the same ? Set f = x + y as a computed expression in the global m[x,y,z,f] ?
a. We would want to use the global API to change f programmatically using code
Back in my COBOL days, there was a utility that would analyze running COBOL code and expose bottle necks and those modules that were inefficient or were executed multiple times. This was to help the programmer know where to concentrate streamlining efforts.
I was wondering if InterSystems offers any message profiling capabilities. What I mean by "message profiling" is essentially stats or metrics gathered from a collection of data submissions of a particular type. For instance, average number of segments <XYZ> in a specific HL7 V2 message type. Or the number of sections found in a HL7 V3 CDA documents.
Curious if there is anything like this provided "out-of-box".
Has anyone ever estimated the amount of disk space consumed by the iKnow indexing process ? I know this will be a rough estimate, but, I imagine that for sizing purposes, that would be enough.
The language the unstructured text is in is English.
I work on an ERP system and am trying to set up a dashboard according to a customer request. It's a pivot table with a few controls and filters, nothing too difficult, but I'm having some issues with drill down.
Hello,
I need help in health insight. I am trying to generate reports on deep see but i am not able to pull in the patient ids as these are our requirements for the project. Can anyone help me in unlocking this feature.
Can anyone help me with link to correct documentation on how to access the edge gateways of multiple facilities to access the clinical data on sql explorer.