Customising Analytics Visualization: Dashboards and Widgets. DeepSee Web Part 2
Hi, Community!
In the second part about DeepSee Web, I’ll describe what customization options you have with DSW.
There are two types of customizations: widget customization and dashboard panel customization.
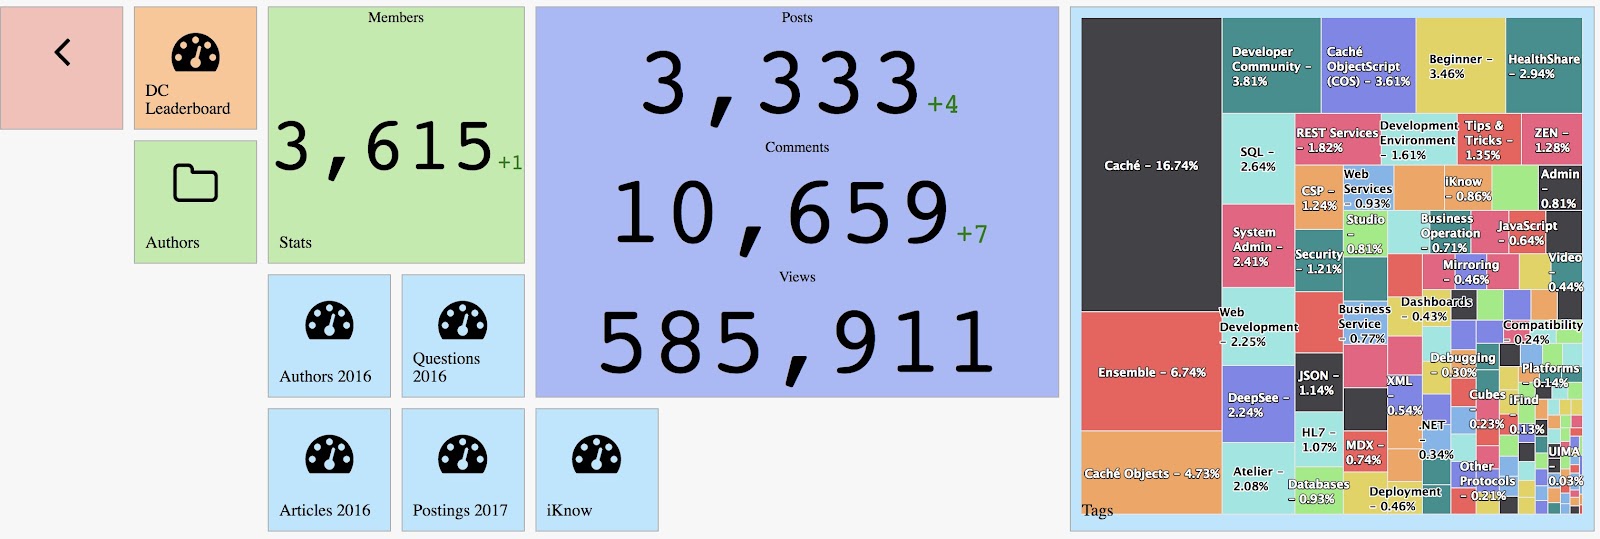
Example of dashboard customization on Developer Community analytics.
Widget Customization
Every graph widget in DSW can be tweaked by the following elements: legend, legend elements, values, top/all switcher.
You can find the tweak panel in the right corner of every graph widget.
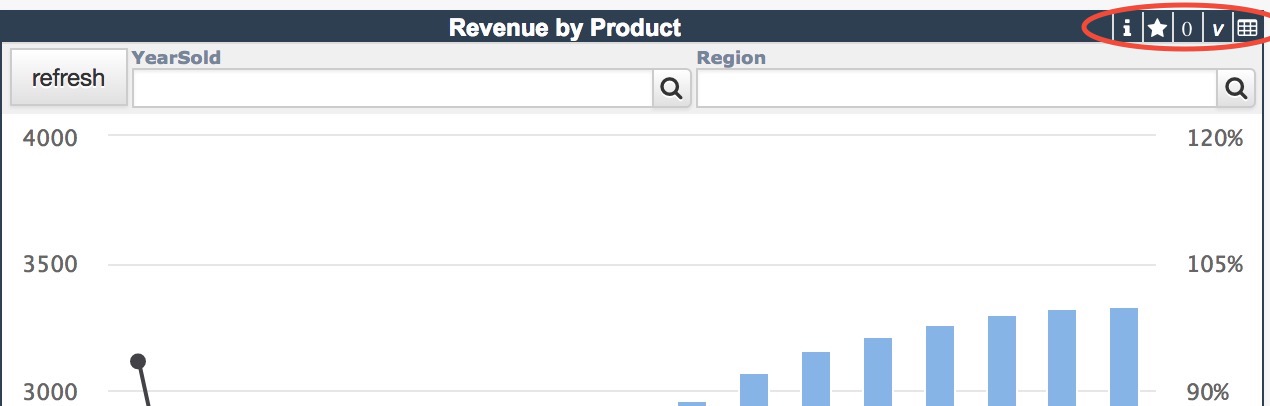
Let’s see how it works.
The Legend
The small “i” stands for legend switcher. Click it to show/hide the legend. Also, you can show/hide any certain element of legend.
Top Rows Filter
The star button is top/all switcher which helps to quickly turn on/off the top-20 filter for the first measure in a pivot.
Values Switcher
“V” means vendetta values. Click it to show/hide values for the rows.
Widgets Layout
DSW initially gets widget layout from DeepSee dashboard resource and scales it accordingly to scale in DSW Settings: colcount (12 default) and widgets minimal height (100).
You can move and set the layout of widgets in the way you want. Especially it makes sense when you need to place the Filter control (Filter control automatically appears if you have any filters placed on the dashboard instead of widget).
Dashboard panel customization
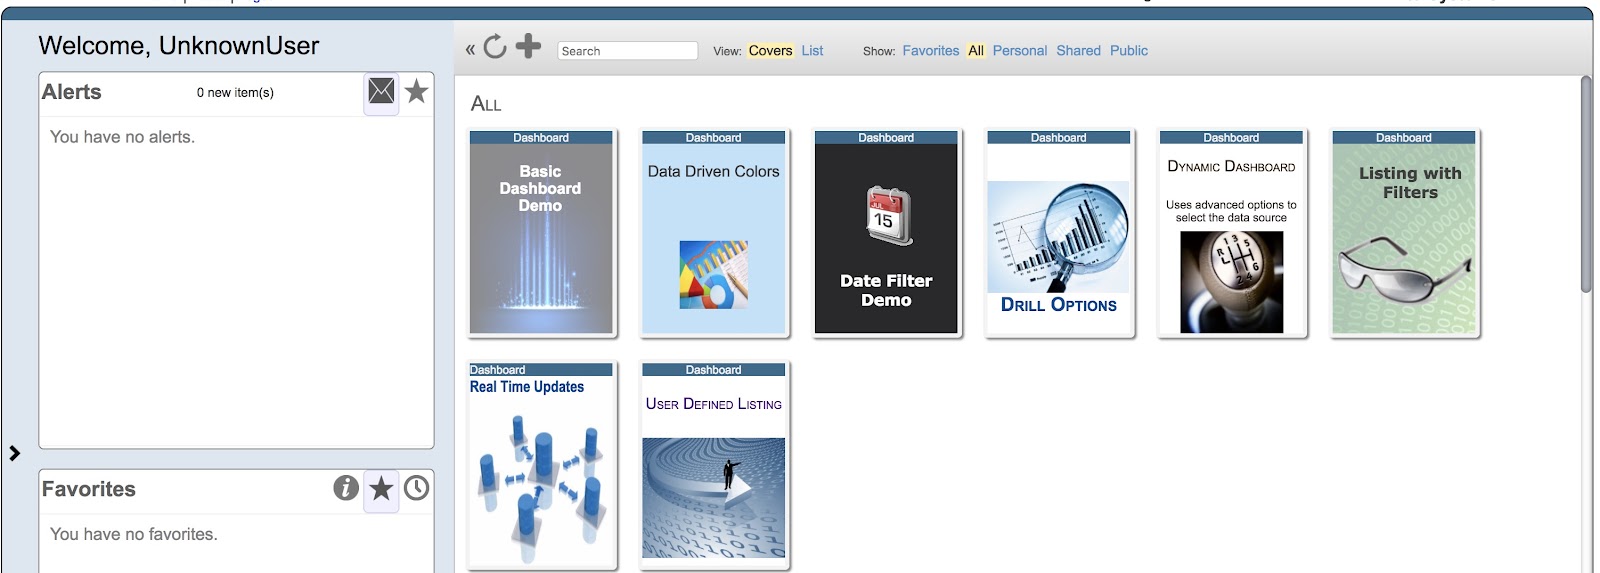
In DSW you can customize how dashboard panel and tiles/covers look like.
Here is Classic DeepSee Dashboards panel view:
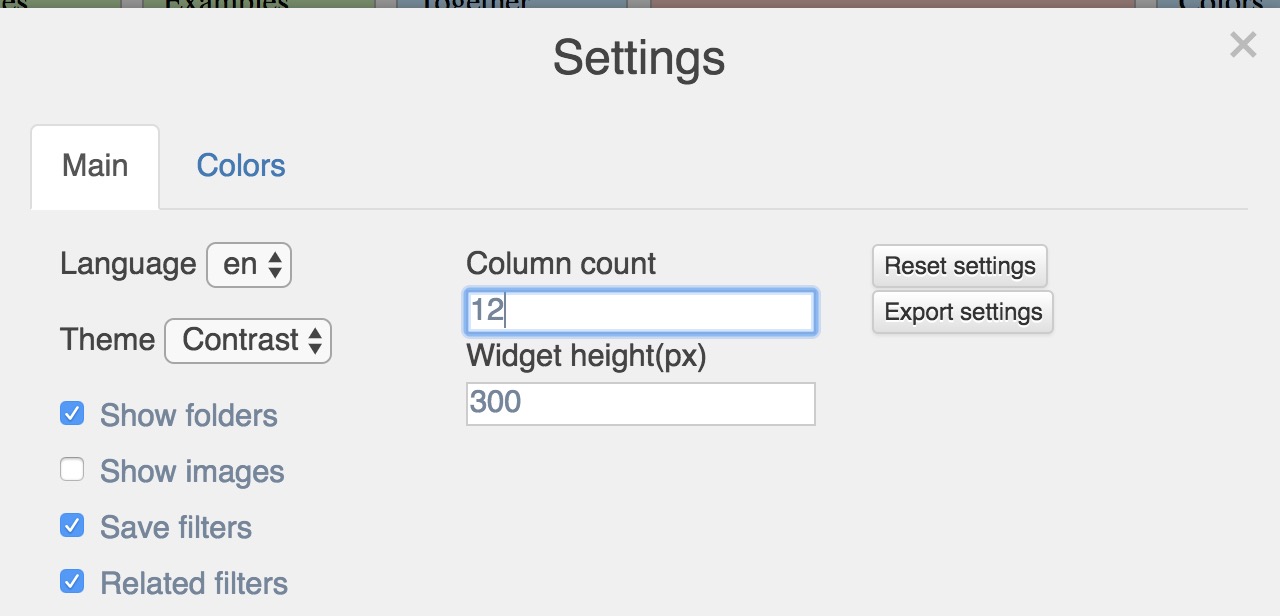
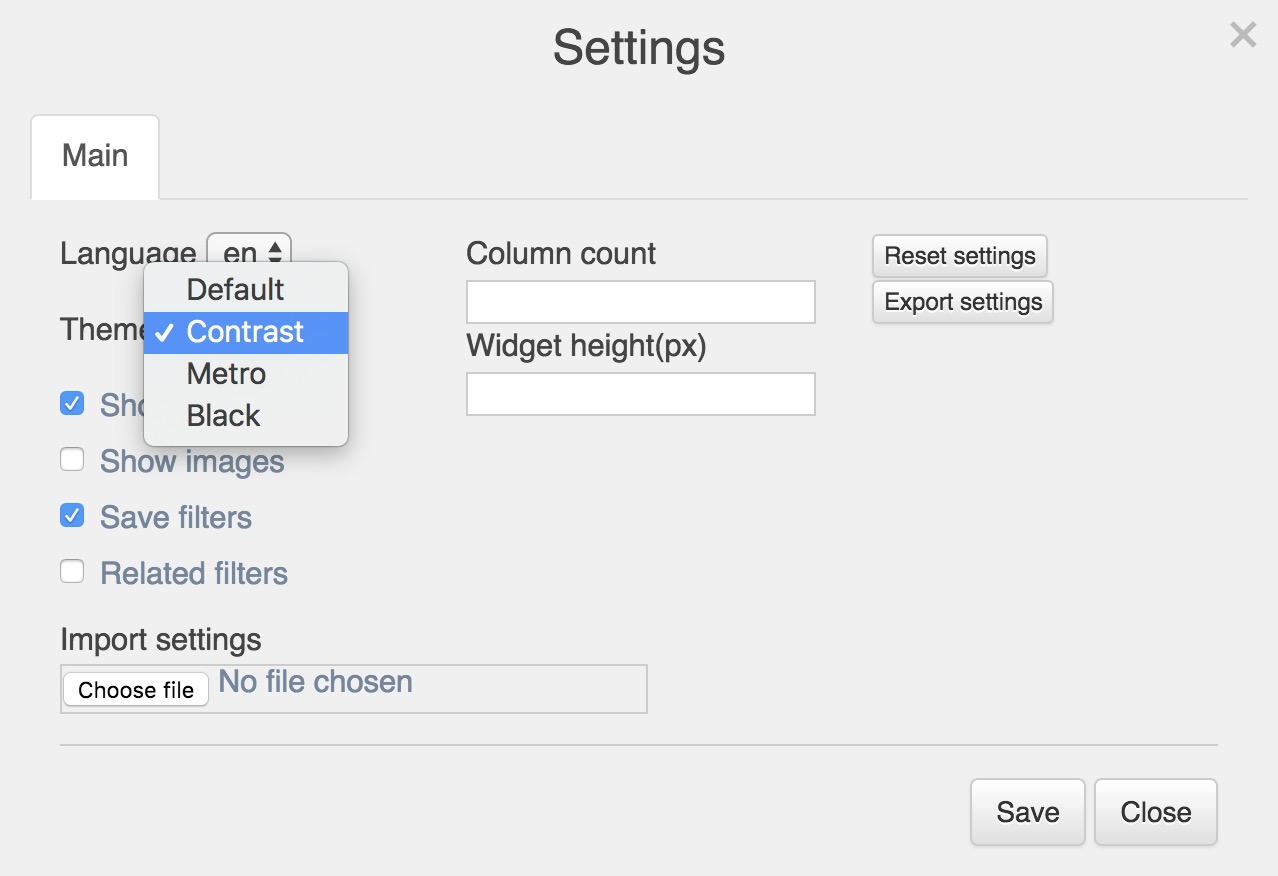
There are 3 ways In DSW to customize the Dashboard panel view ( you can alter customization in Settings):
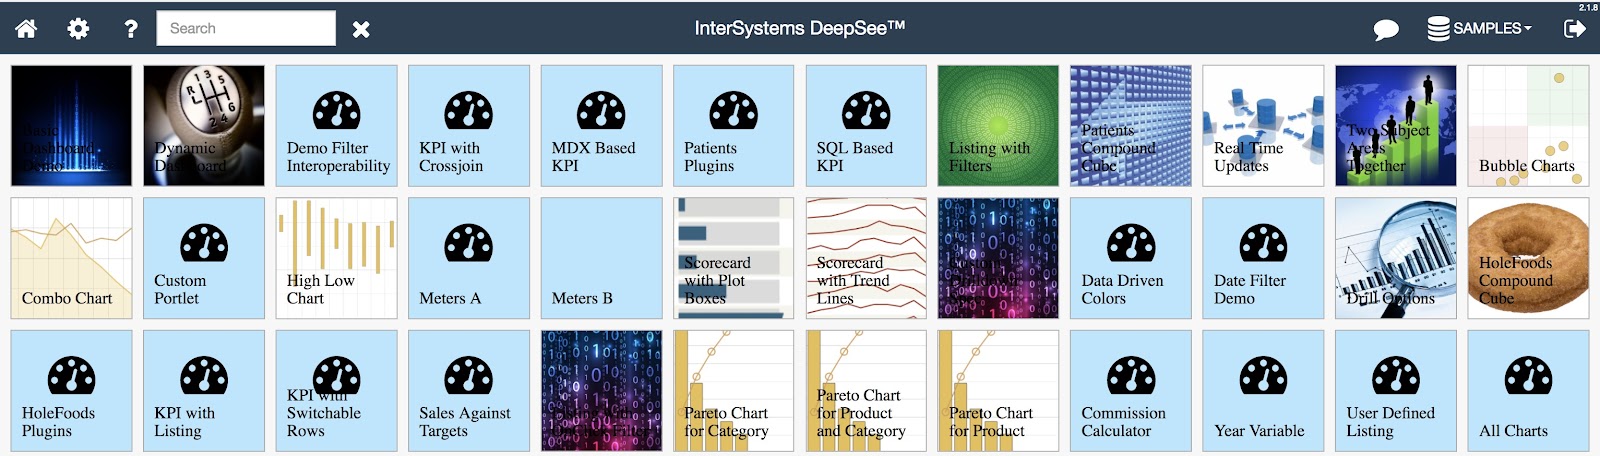
Turn on Show images to get images from DeepSee on dashboards covers:
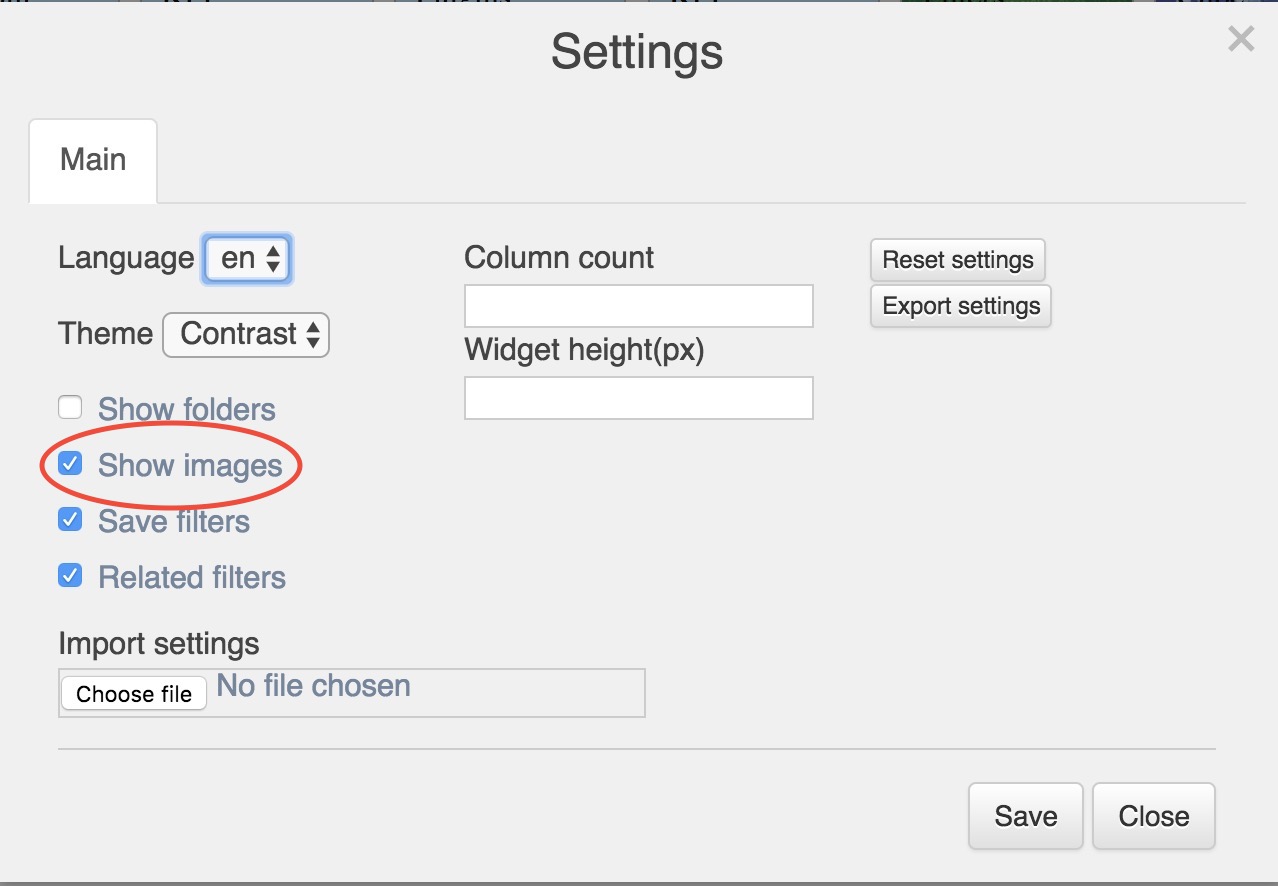
And get the Dashboards panel with images:
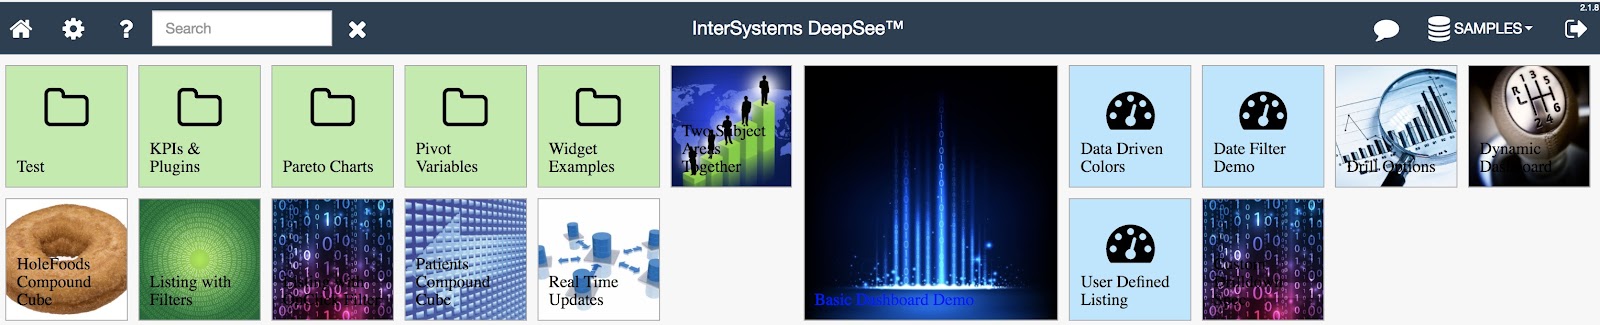
Choose Show folders, and get same Dashboard panel organized in folders:
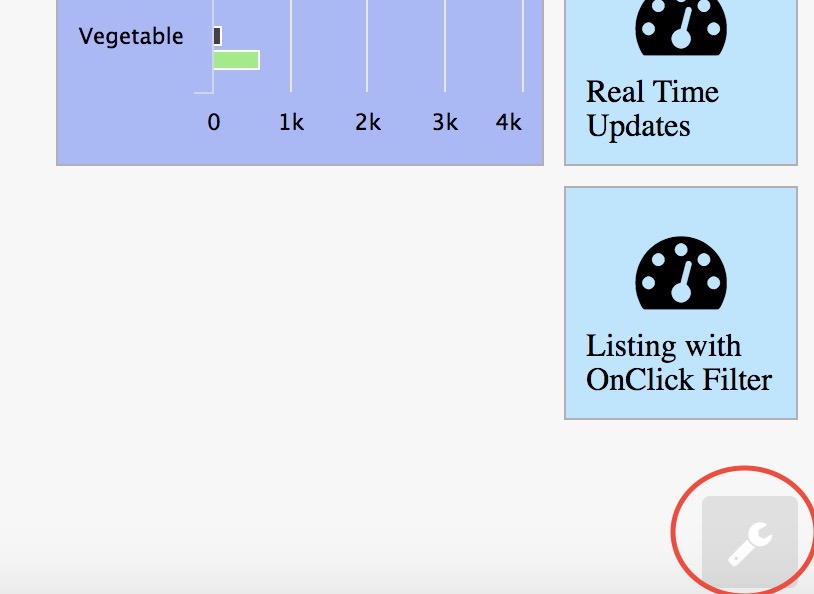
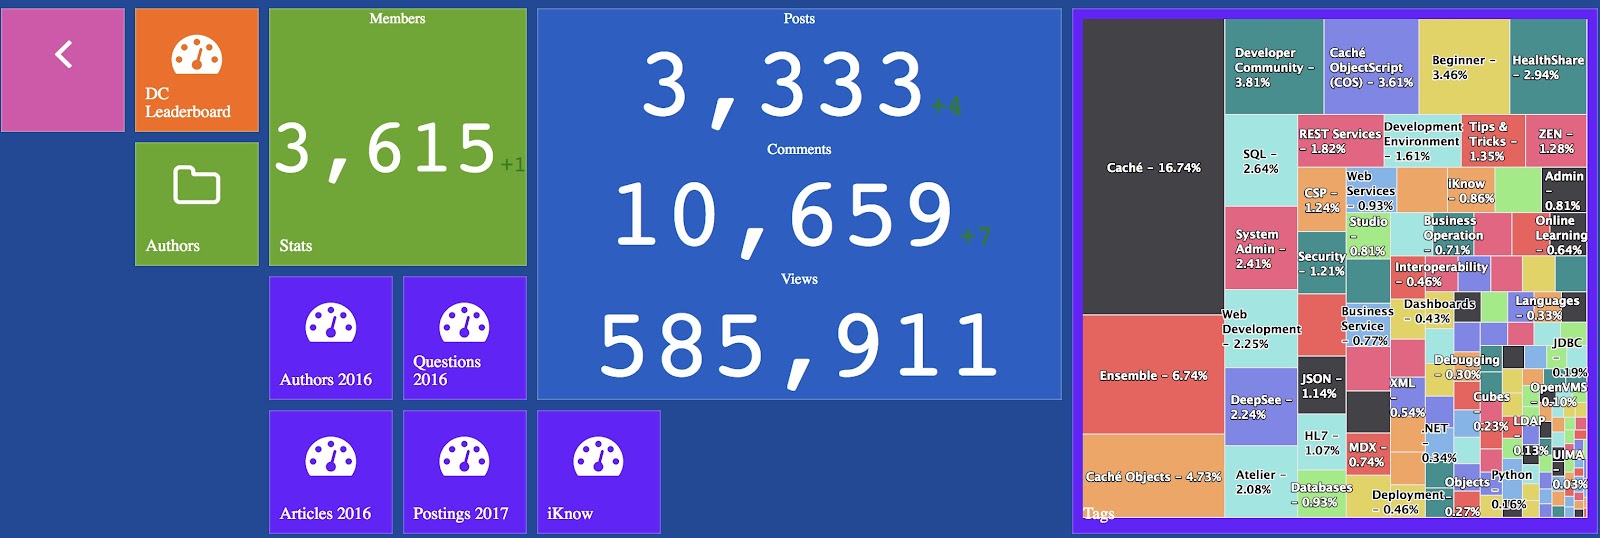
Also, you can tweak the color, size of dashboard covers and make them interactive.
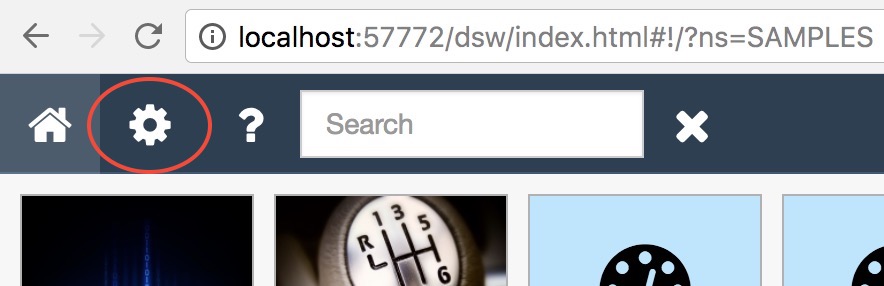
Open the Tile Editor in the right corner of Dashboards Panel.
Customization Deployment
What about deployment? How to deliver the settings and customizations from dev to your production solution?
To do this you can export the current set of customizations in the Settings menu.
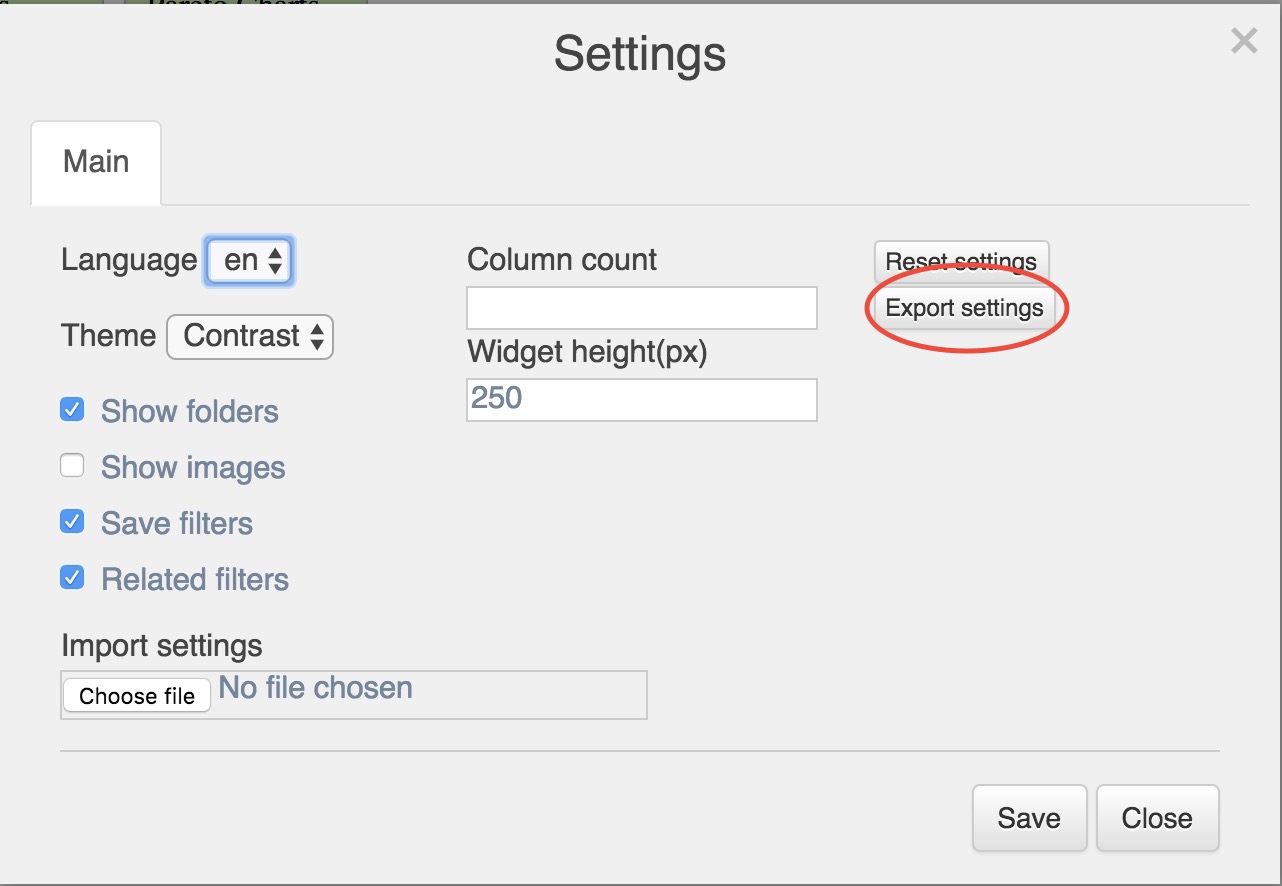
It will export all the settings to settings.json file, which you can deploy on a target production server. DSW expects to find the file with settings in /csp/dsw/configs/namespace.json file.
E.g. here is the samples.json file, which you can place in your DSW installation in /csp/dsw/config/samples.json and DSW will automatically load the settings for dashboards in this namespace.
Customization never ends
It’s a known issue that in every case with design, settings, tweaks, etc there is always a room for more customization. So, if you want any more features in this field, please feel free to introduce issues, or implement this features and introduce a pull request.
And there would be more parts about DSW features. See the part 1 and stay tuned!
Comments
GREAT !
Thanks, Robert!
Great post!
What did you use for screen capture to GIFs?
Thanks, Sergey!
> What did you use for screen capture to GIFs?
Google it and you'll get thousands. It's a really number of it. I'm using LICEcap.
Recently released 2.1.12 version of DSW provides color customization for a particular widget.
The data on the widget-specific colors is stored in same json settings and can be deployed on the production host.