COVID-19 Analytics on InterSystems IRIS
Hi colleagues!
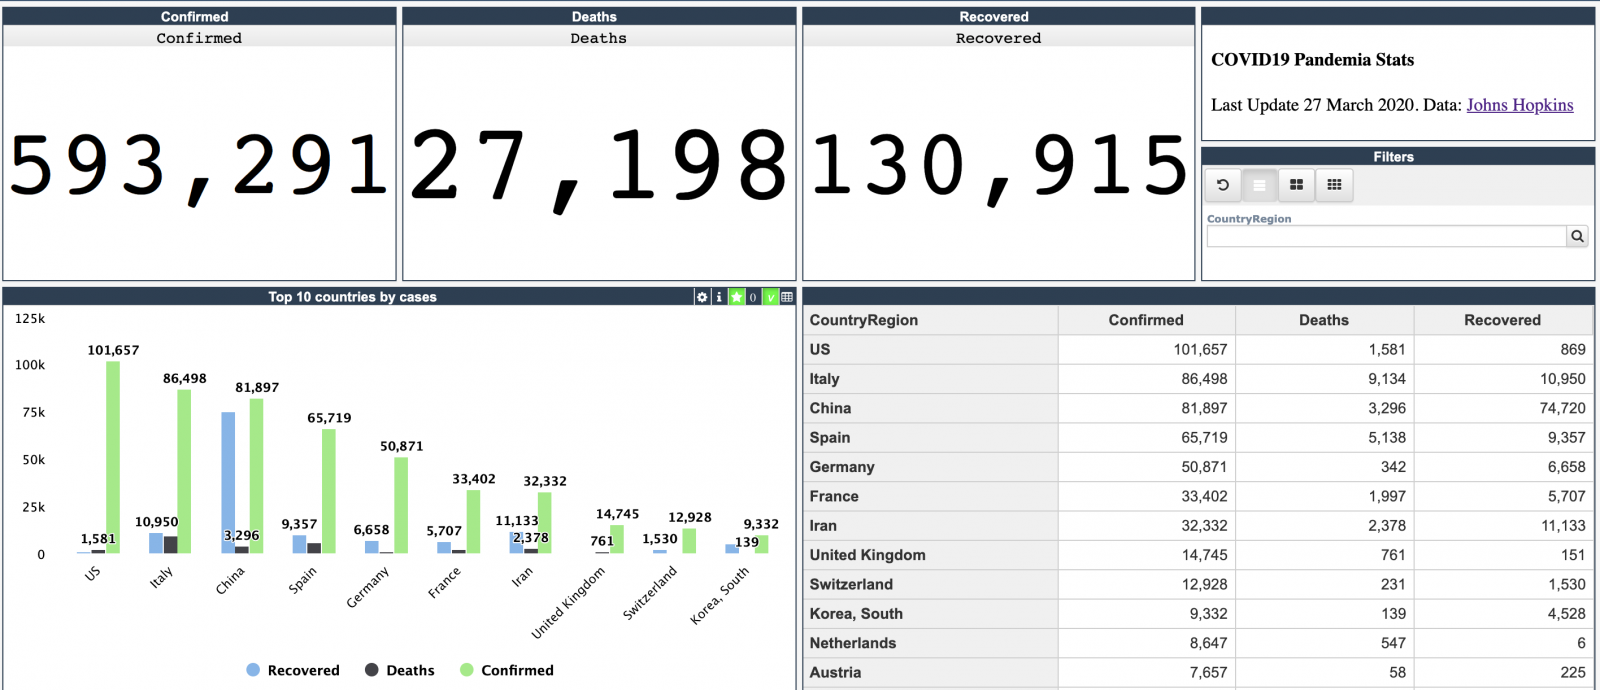
Every day Johns Hopkins University publishes new data on coronavirus COVID-19 pandemic status.
I built a simple InterSystems IRIS Analytics dashboard using InterSystems IRIS Community Edition in docker deployed on GCP Kubernetes which shows key measures of the disease outbreak.
This dashboard is an example of how information from CSV could be analyzed with IRIS Analytics and deployed to GCP Kubernetes in a form of InterSystems IRIS Community Edition.
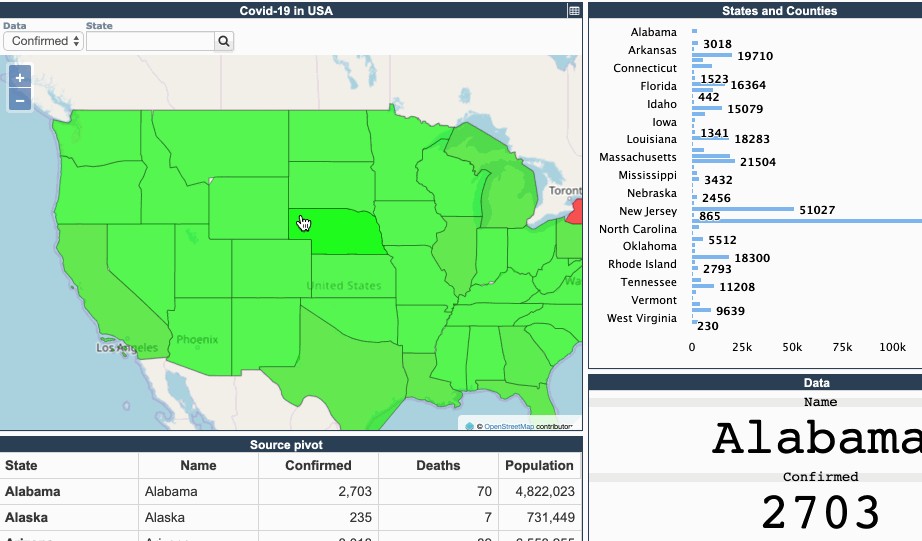
Added the interactive map of the USA:
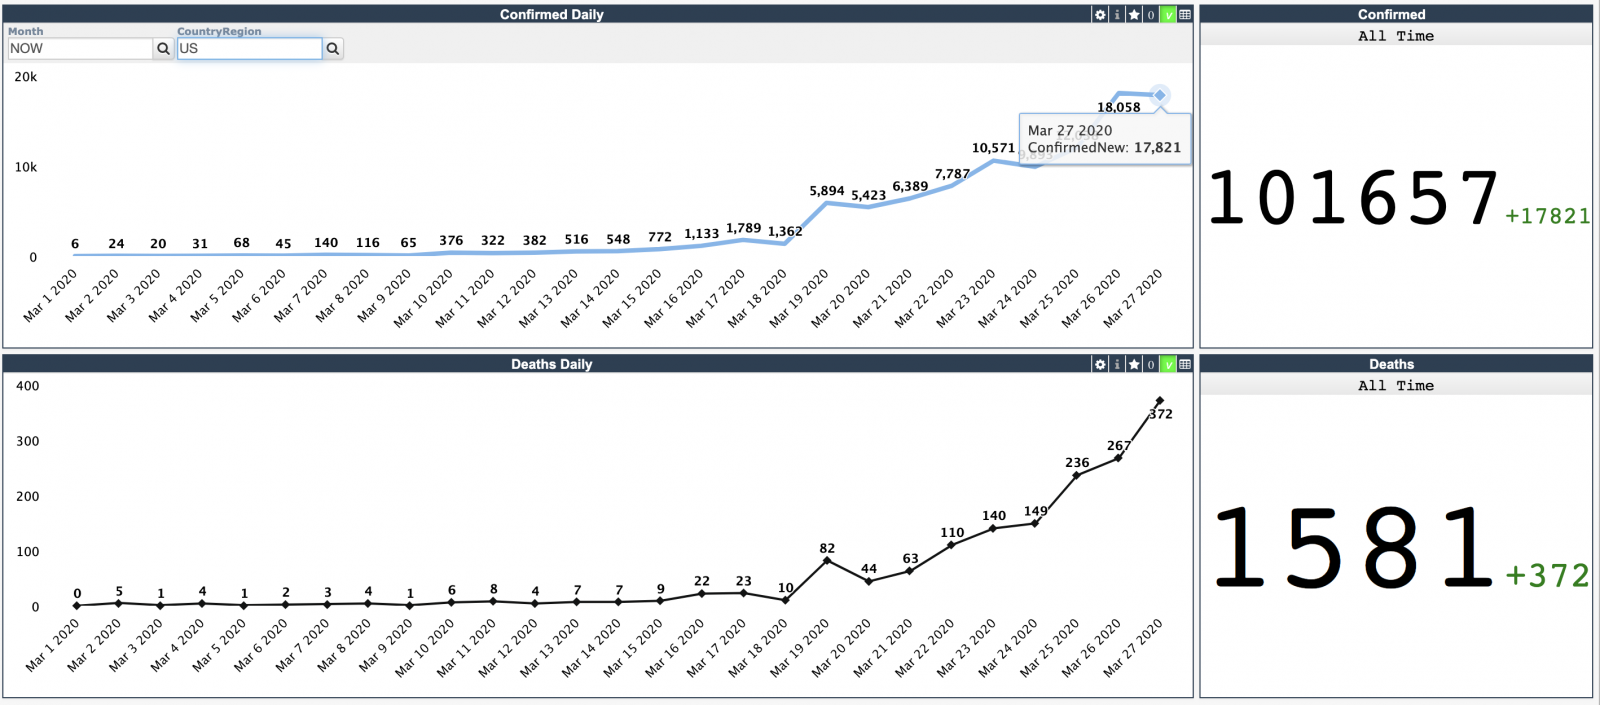
The next dashboard shows the timeline:

And can be filtered by country. E.g. here is in the USA:
The source code of the application is available on Open Exchange.
How does it work?
Demo runs using InterSystems IRIS Community Edition docker container and exposes InterSystems IRIS BI dashboards using DeepSee Web representation layer via MDX2JSON REST API. Its deployed on GCP and operates using Google Kubernetes Engine (GKE).
How it was developed
The data is taken from the Johns Hopkins repository in CSV form.
Classes, cubes, and initial pivots were generated via Analyzethis module, thanks @Peter Steiwer!
Import method then was introduced using the CSVTOCLASS method, thanks @Eduard Lebedyuk!
Dashboards are rendered with DeepSee Web (DSW) module.
IRIS BI artifacts (pivots, dashboards) were exported by ISC.DEV module:
IRISAPP> d ##class(dev.code).workdir("/irisdev/app/src")

IRISAPP> d ##class(dev.code).export("*.dfi")
The code has been developed using VSCode ObjectScript, thanks @Dmitry.Maslennikov.
Building docker image for development and deployment
All the deployment sits in Dockerfile. With Dockerfile we build an image with data, web apps and modules installed and properly setup and then we deploy the image to GCP Kubernetes.
This Dockerfile is a modified version of this Template Dockerfile which is described very well in this article.
All the preliminary steps are being done in iris.script file:
Here we install DeepSee Web.
zpm "install dsw"
This enables IRIS Analytics (DeepSee) for /csp/irisapp web app:
do EnableDeepSee^%SYS.cspServer("/csp/irisapp/")This code is needed to make the analytics web app be available without credentials:
  zn "%SYS"
  write "Modify MDX2JSON application security...",!
  set webName = "/mdx2json"
  set webProperties("AutheEnabled") = 64
  set webProperties("MatchRoles")=":%DB_IRISAPP"
  set sc = ##class(Security.Applications).Modify(webName, .webProperties)
  if sc<1 write $SYSTEM.OBJ.DisplayError(sc)
And here in Dockerfile this command helps to set DSW configuration.
COPY irisapp.json /usr/irissys/csp/dsw/configs/
Deployment to Kubernetes
The deployment procedure is being processed by Github Actions - and this workflow handles it on every commit to the repository.
Github workflow uses Dockerfile we built on a previous step along with Terraform and Kubernetes settings.
The procedure is identical to the one described in this article by @Mikhail.Khomenko.
How to run and develop it locally
You are very welcome to run, develop and collaborate with this project.
To run it locally using docker do:
Clone/git pull the repo into any local directory
$ git clone https://github.com/intersystems-community/objectscript-docker-template.git
Open the terminal in this directory and run:
$ docker-compose build
- Run the IRIS container:
$ docker-compose up -dOnce the container is built up and running open the application on:
localhost:yourport/dsw/index.html#/irisapp
How to Develop
This repository is ready to code in VSCode with the ObjectScript plugin. Install VSCode, Docker, and ObjectScript plugin and open the folder in VSCode.
How to Contribute
Fork the repository, make changes, and send Pull Requests. See the video for more information.
Would love to see your contribution!
Comments
Wow Evgeny, this is very cool. Thank you.
Thank you, Joe!
This is a rather simple example but it could be a good beginning in working with COVID-19 data with InterSystems IRIS on a local machine and docker container along with a GitHub Actions deployment workflow to Google Kubernetes cloud.
Great to see this!
Look forward to people using it and improving / extending it!
Thank you, Jeff!
Yes!
Developers! The repository is fully prepared for collaboration! Your forks and Pull Requests are very welcome!
The US reached 100K COVID-19 confirmed.
Italy and USA both lead the disease stats:
Introduced the second dashboard: -Covid timeline.
And can be filtered by country. E.g. here is the USA:
Introduced the interactive map of the USA on the spreading of COVID-19.

Thanks to @Semyon Makarov for DSW-map, @Eduard Lebedyuk for the help with DeepSee IRIS Analytics, and @Arun Tiriveedhi for the PR for the update from Github data source.

this is fixed too
Added a new dashboard with a bubble chart on Confirmed-Recovered-Deaths for Top-10 countries:

💡 This article is considered as InterSystems Data Platform Best Practice.