Explore Text Data with InterSystems iKnow Entity Browser
This article introduces InterSystems iKnow Entity Browser, a web application which allows to visualize extracted and organized text data mined from a large number of texts, powered by InterSystems iKnow technology, which is also known as InterSystems Text Analytics in InterSystems IRIS. Feel free to play with the demo of this tool or learn more about it on InterSystems Open Exchange.
I started the development of this project in late 2016. From now on, my iKnow Entity Browser is used around the world by those who use InterSystems technology in their stack and those who do text mining. This article should have appeared earlier, however, it's never late to tell something about the useful stuff!
What InterSystems Text Analytics is About
InterSystems iKnow (or InterSystems Text Analytics) is an embeddable NLP technology which allows to extract meaningful data from texts. Well, not only just to extract this data, but also to gather it, link, filter and prioritize. As a result, InterSystems iKnow provides a solid ground for building data applications for data mining.
From the programming perspective, iKnow provides a rich API which allows to embed this technology to any application, regardless of its programming language. iKnow Entity Browser uses this API to visualize the processed data in a form of a tree of concepts and relations.
Before InterSystems iKnow Entity Browser was released, the only out-of-the-box solution available for data exploration was the embedded iKnow viewer, which is shipped together with InterSystems' Cache-based and IRIS products. This viewer features many useful tools primarily for searching something in the processed text (in iKnow it is called domain), while iKnow Entity Browser is created also to visualize and organize concepts in a text.
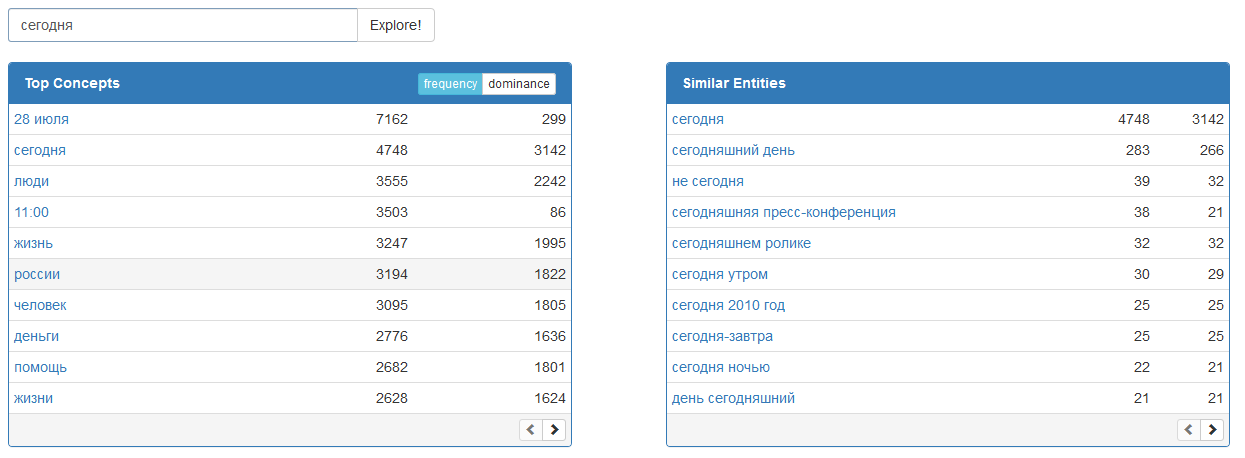
iKnow Knowledge Portal Look
iKnow Entity Browser
iKnow Entity Browser is an open-source project, meaning that anyone can contribute to its core. Here's the list of features that have been developed:
- visualization of similar and related concepts as a tree (snowflake diagram), zoom in and out support;
- graph editing tools: selection, deletion, undo & redo operations;
- data source customization, which also enables exploring the graph on remote servers;
- customizable tabular view of all entities presented on a graph, which can also be exported as a *.csv spreadsheet;
- mobile-friendly, touch-compatible, responsive user interface.

iKnow Entity Browser Graph Demo
Installation
iKnow Entity Browser installation is pretty straightforward. Download the latest release (XML file) of the application and import it into iKnow-enabled namespace (for example, SAMPLES). This works with all latest InterSystems product releases, including InterSystems IRIS data platform. To import XML file, you can drag & drop the file onto the Studio (Atelier) window. Alternatively, you can import the file using the system management portal, in system explorer — classes. Then, open your browser at http://localhost:57772/EntityBrowser/ web page (change the host/port respectively to your server's setup and mind to append the trailing slash / at the end of the URL).
To delete the application, simply delete the EntityBrowser package from Studio/Atelier. The installed web application will be deleted automatically if it wasn't modified since installation, the same way as it gets created during the installation.
Currently, to use iKnow Entity Browser in different namespaces, you need to import it to each iKnow-enabled namespace, and manually set up web application (for example, you can clone /EntityBrowser application and rename it). Change the settings inside the web application to corresponding ones in this case (read the customization guide below).
If you installed iKnow Entity Browser on the server and made the web application public, you can connect to this server from any front end, for example, even from this demo application.
Customization
Application's setting menu, located in the top right corner of the user interface allows to customize the appearance and data source. In the settings menu, you can specify the following (see the image below):
- Data source URL, which identifies the server with installed iKnow entity browser (/EntityBrowser web application).
- Domain name. When you create a new domain in InterSystems iKnow, you specify the name of the domain. This name goes into domain name input.
- A seed concept name which builds the graph. By default, iKnow Entity Browser builds the graph starting from related concepts to the seed concept you specify, however, you can change it to be similar concepts, using the drop-down menu on the left side from the seed concept input or the drop-down menu in the main view if enabled.
- Whether or not to place the seed concept input in the main view.
- Whether or not to place the query type drop-down menu in the main view.
- Whether or not to show hidden nodes in the tabular view. Hidden nodes are those which are not expanded in a view but present in a query result.
- Columns that are displayed in a tabular view. Here you can customize the column name and select a value it displays (ID, inbound edge type, label, score, spread, frequency, parent concept's label, parent concept's id).
- Reset all settings to defaults.
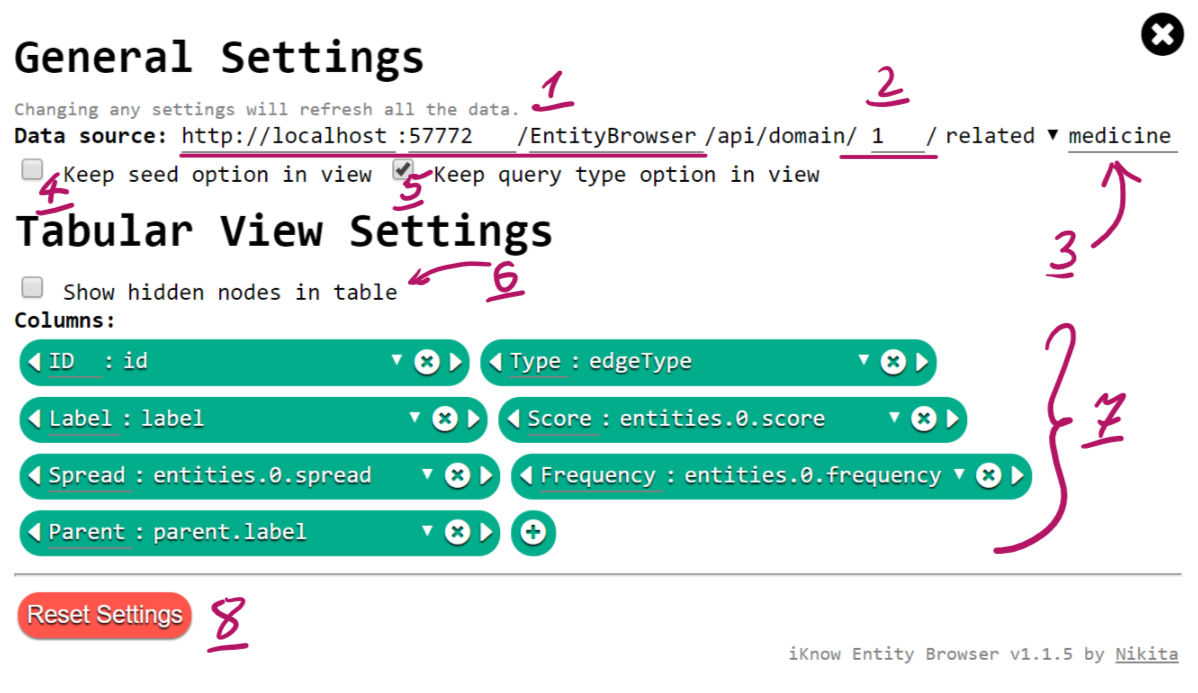
iKnow Entity Browser Settings
The Graph
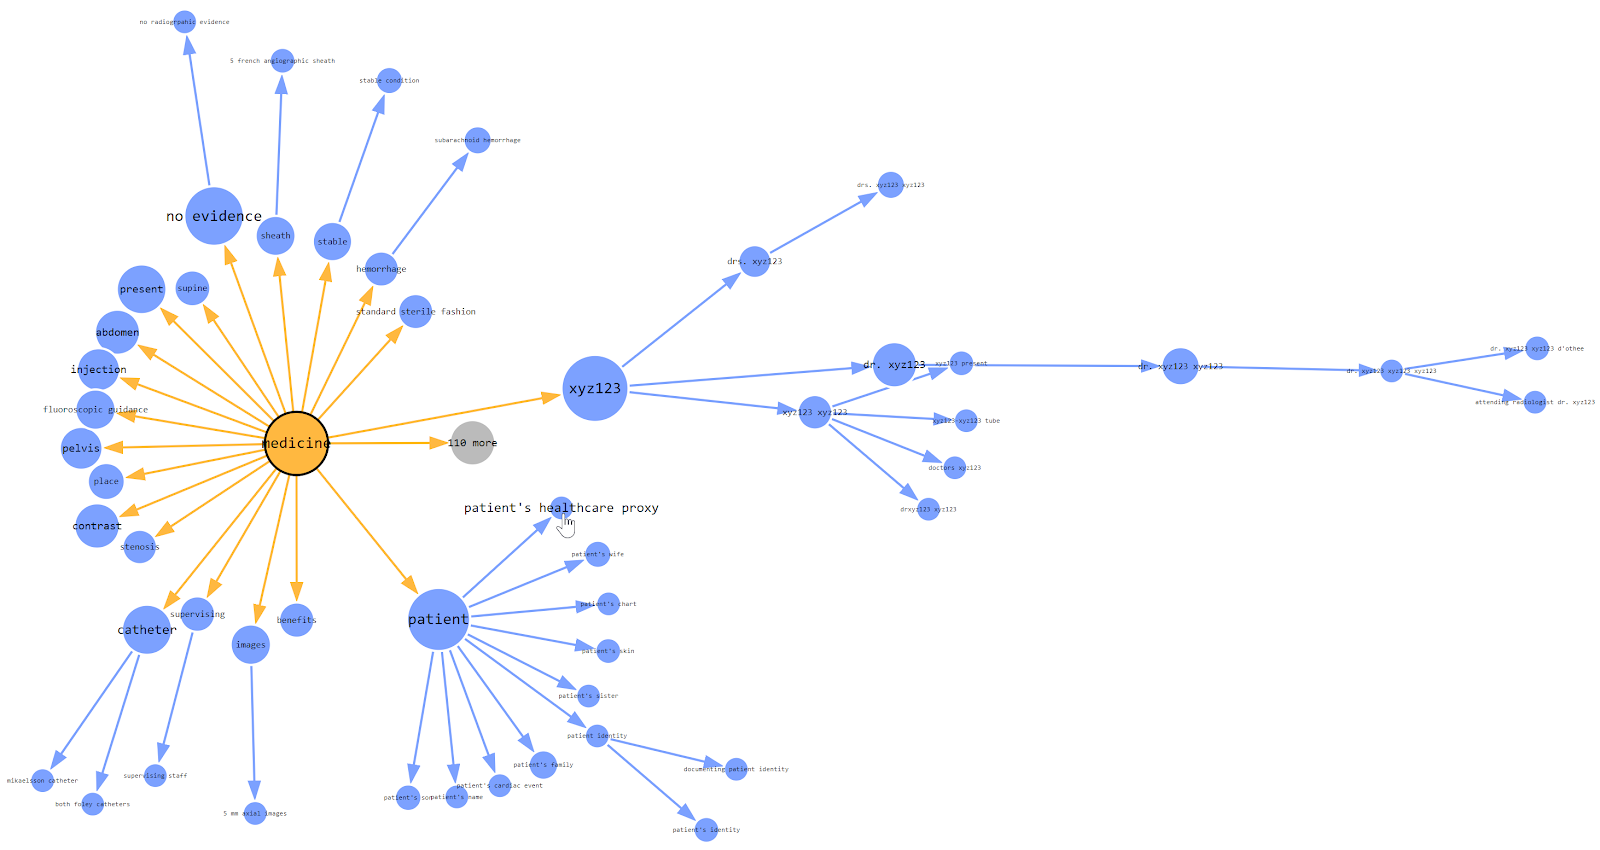
Once the seed concept is specified in settings, iKnow Entity Browser builds a graph of similar or related concepts to the seed concept. You can play with this graph by dragging its nodes, however, the physical force will always try to organize it in a form of the snowflake diagram.
The graph can be edited using the controls in the bottom of the screen. This includes undo/redo buttons, zoom in/out and reset zoom buttons, reset selection button, unlink and delete selection buttons. Hovering over any of these buttons displays a tooltip.
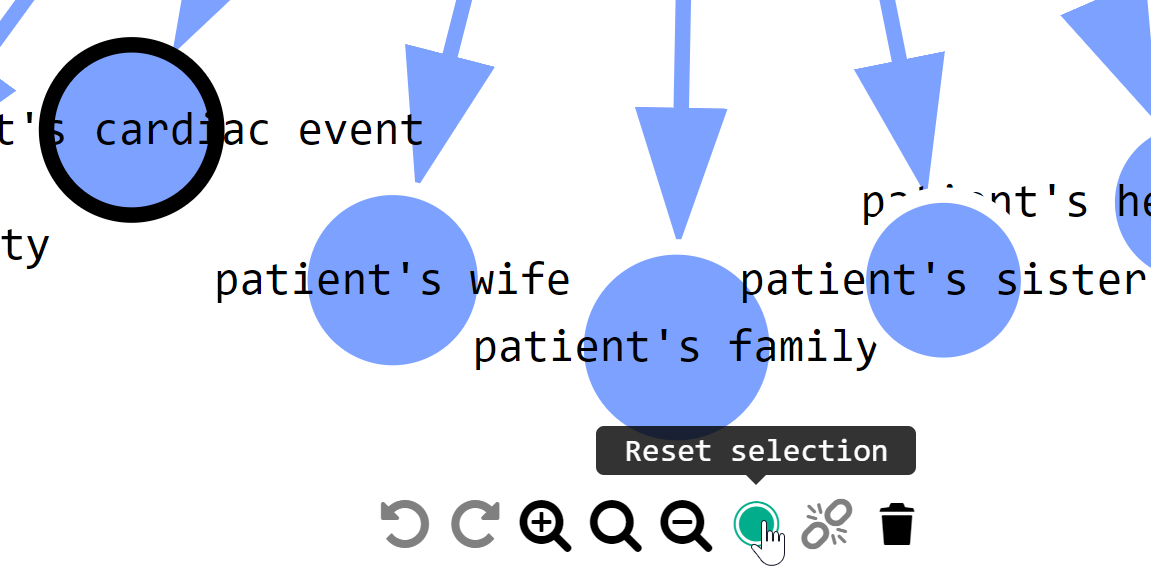
Menu with controls
In case you need a list of selected concepts, you can toggle a tabular view by pressing on the corresponding button in the top right corner. Everything you do on the graph stays in sync with the tabular view and vice versa.
In the tabular view, once you hover over one of the rows, the corresponding node is highlighted on the graph. If you click the row, the graph view automatically focuses on the corresponding node. As well as on the graph, you can click buttons in table rows to select/deselect nodes.
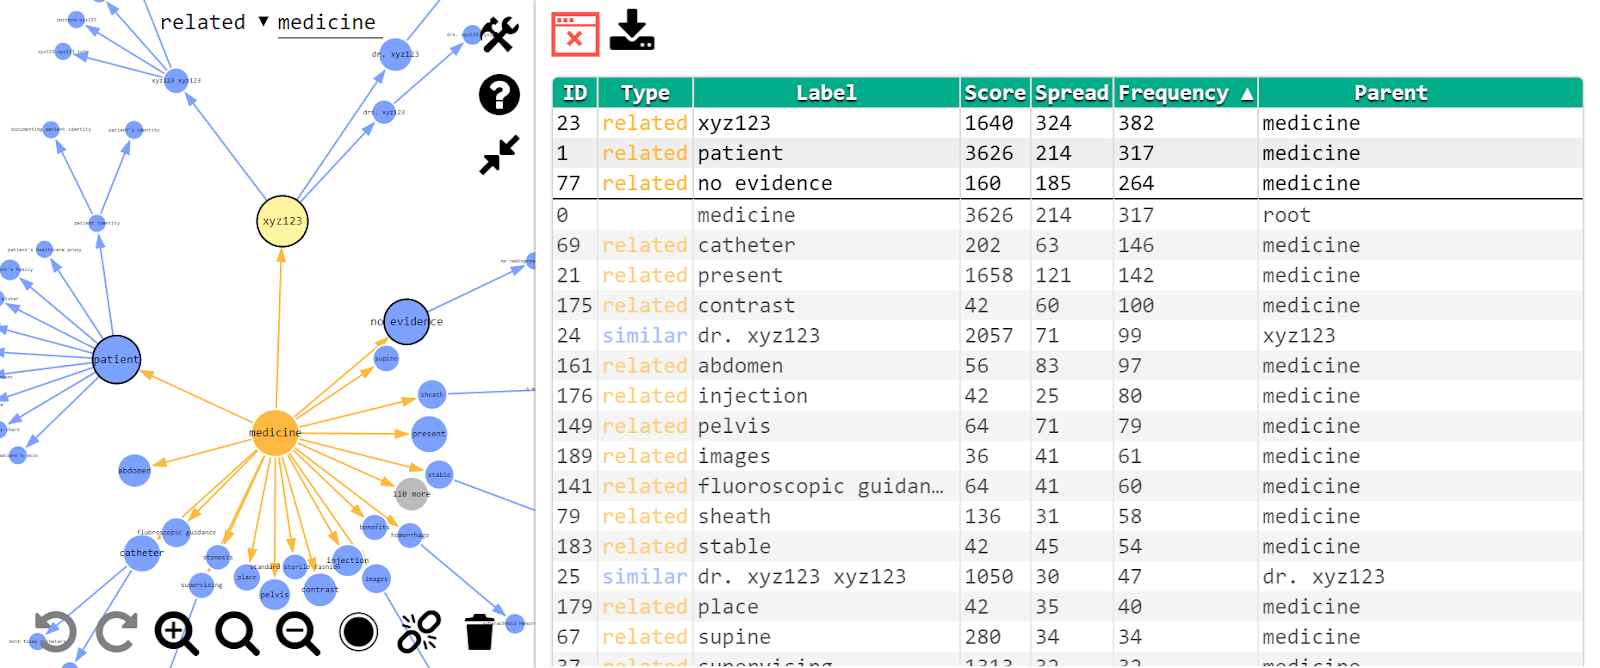
Tabular View
Once you have a selection of nodes, you can export them as a table in *.csv format. Press the tabular view button in the top right corner for the table to appear and then you'll find the "Export" button. This will export all selected nodes in a form of a table, the same table as you have in a tabular view.
There's More
iKnow Entity Browser is just one of the numerous projects I did for InterSystems corporation. Here are some if you haven't seen these projects yet: WebTerminal, Visual Editor, Class Explorer, Light Pivot Table, GlobalsDB Admin. Find these and other InterSystems-related projects on InterSystems Marketplace.
All of my projects are open sourced, allowing others to contribute. The code of these projects is available on GitHub. You can also use their code as an example to build your own application on top of InterSystems' products. If you take a closer look, you'll find out that most of them are installable packages, shipped in a single XML file. If you are curious about using the same strategy for your packages, check this article.
Hope you'll find iKnow Entity Browser and other projects useful! Enjoy!
Comments
Thanks for posting Nikita. Your visualization has indeed been extremely helpful in showing what iKnow entities are all about to new audiences and is easily embeddable in applications where large numbers of entities need to be explored or navigated!
Thank you Benjamin! Glad to hear this ![]()
Thanks for posting.
I followed the install directions and customized the domain and seed word and the web browser seemed to indicate that it was processing and never stopped. CPU usage was overloaded and I'm having to reboot the server. Has anyone else encountered this?
In EntityBrowser.API class set PAGESIZE parameter to 100 and compile the class.
Thanks, that fed me results quickly. What is this doing? I'm familiar with PAGESIZE as it relates to number of rows returned. I've noticed nodes now that say to display x more. So is this returning first 100, top 100, or something different?
TOP 100.