Hi Developers,

Our first Online Developer Roundtable of 2024 will take place on March 5th at 9 am ET | 3 pm CET.

Tech talks:

  1. ObjectScript Unit Testing Tools, Techniques and Best Practices - by @Timothy Leavitt , Development Manager, Application Services, InterSystems
  2. Monitoring and Alerting Capabilities of InterSystems IRIS - by @Mark Bolinsky , Principal Technology Architect, InterSystems Mark's presentation is rescheduled for the roundtable in April.

Update: watch the recording of the roundtable below:

https://www.youtube.com/embed/mIAMvaCHlk8
[This is an embedded link, but you cannot view embedded content directly on the site because you have declined the cookies necessary to access it. To view embedded content, you would need to accept all cookies in your Cookies Settings]

5 5
1 220

Welcome to the next chapter of my CI/CD series, where we discuss possible approaches toward software development with InterSystems technologies and GitLab.
Today, we continue talking about Interoperability, specifically monitoring your Interoperability deployments. If you haven't yet, set up Alerting for all your Interoperability productions to get alerts about errors and production state in general.

Inactivity Timeout is a setting common to all Interoperability Business Hosts. A business host has an Inactive status after it has not received any messages within the number of seconds specified by the Inactivity Timeout field. The production Monitor Service periodically reviews the status of business services and business operations within the production and marks the item as Inactive if it has not done anything within the Inactivity Timeout period.
The default value is 0 (zero). If this setting is 0, the business host will never be marked Inactive, no matter how long it stands idle.

This is an extremely useful setting since it generates alerts, which, together with configured alerting, allows for real-time notifications about production issues. Business Host being idle means there might be some issues with production, integrations, or network connectivity worth looking into.
However, Business Host can have only one constant Inactivity Timeout setting, which might generate unnecessary alerts during known periods of low traffic: nights, weekends, holidays, etc.
In this article, I will outline several approaches towards dynamic Inactivity Timeout implementation. While I do provide a working example (currently running in production for one of our customers), this article is more of a guideline for building your own dynamic Inactivity Timeout implementation, so don't consider the proposed solution as the only alternative.

5 0
0 1K
Article
· Jun 9, 2016 1m read
Ensemble monitoring

First post! In order to somewhat redeem myself for an unnecessary call to support, I've decided to post some classes that I've written to monitor certain metrics inside our Ensemble Live instance (yeah, Kyle, you WERE laughing at me, but it's okay). What the classes do is to run queries and code to get database sizes, status of the mirror, counts of rows in tables such as EnsLib.HL7.Message and Ens.MessageHeader. The data is collected and written to tables and then an email is sent out daily upon completion. I've found this quite useful in keeping an eye on what's going on. It's help

5 5
1 891

GA releases are now available for the first version (v1.0) of InterSystems System Alerting and Monitoring (InterSystems SAM for short)

InterSystems SAM v1.0 provides a modern monitoring solution for InterSystems IRIS based products. It allows high-level views of clusters and single-node drilled down metrics-visualization together with alerts notifications. This first version provides visualization for more than one hundred InterSystems IRIS kernel metrics, and users can extend the default-supplied Grafana template to their liking.

5 2
0 434
Article
· Feb 7, 2023 3m read
IRIS Queue monitoring component

1. Overview

With more and more hospital applications built, business interface data processing may be affected by a variety of factors (network, consumer systems, etc.), there is an excessive accumulation of messages or even cause interface lag, affecting the routine performance of hospital IT systems , so the monitoring of the business interface components queue is increasingly important.

While current Intersystems IRIS platform's built-in queue monitoring only displays real-time queue information for interface components, which is limited in providing the queue data information needed by hospitals. The queue monitoring component program is based on the Intersystems IRIS platform and can monitor all interface components and display component queue information within 24h of the component, as well as query component historical queue data by setting a time period to better meet the needs of current in-hospital applications.

4 1
0 216

One of the topics that comes up often when managing Ensemble productions is disk space:

The database (the CACHE.DAT file) grows in a rate that was unexpected; or the Journal files build up at a fast pace; or the database grows continuously though the system has a scheduled purge of the Ensemble runtime data.

It would have been better if these kind of phenomena would have been observed and accounted for yet at the development and testing stage rather than on a live system.

For this purpose I created a basic framework that could aid in this task.

4 7
2 1.2K

Hey Developers,

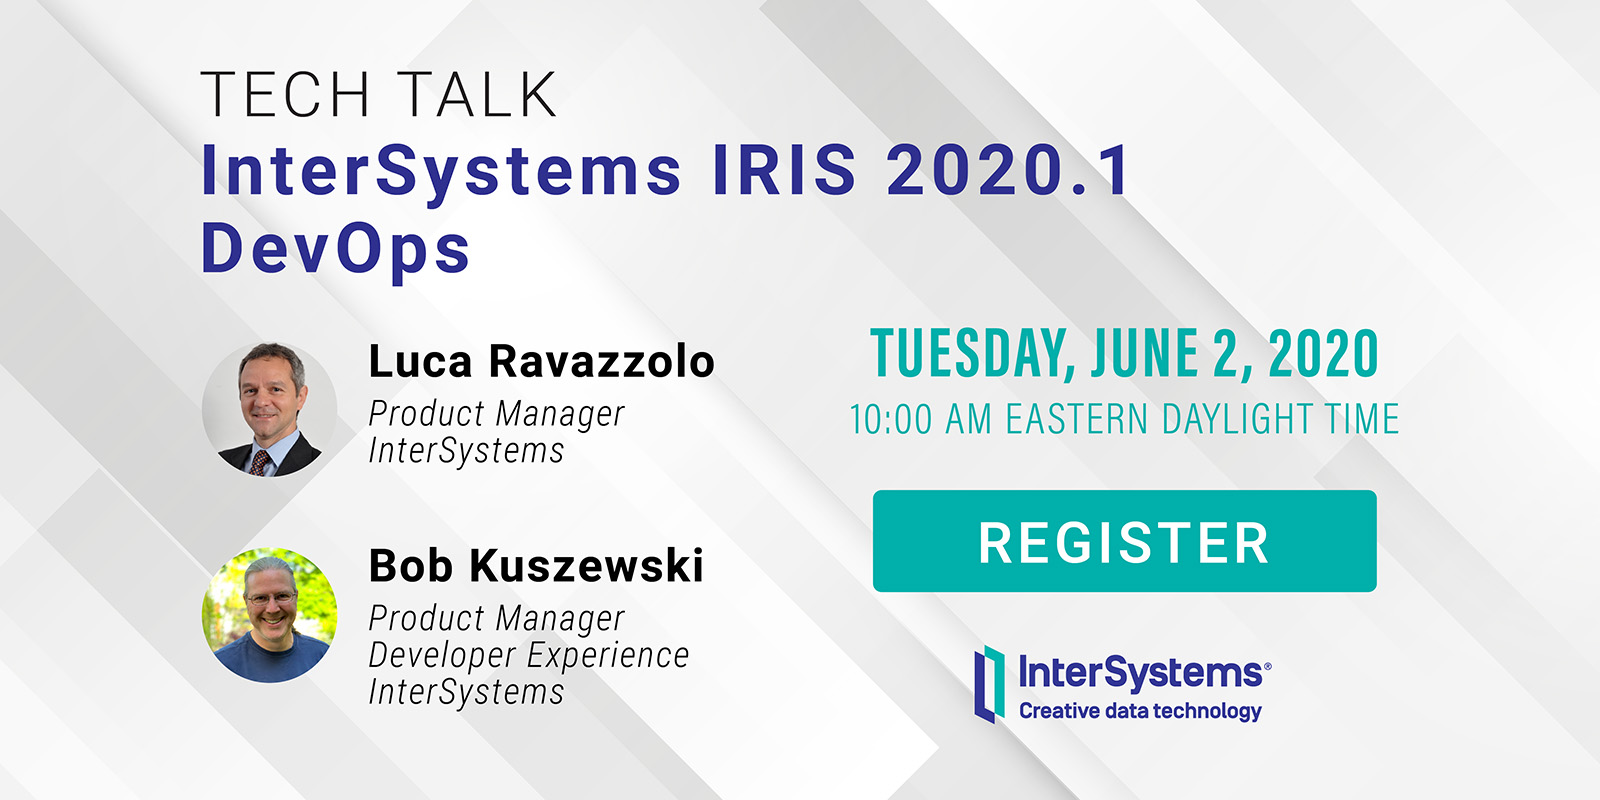
We're pleased to invite you to join the next InterSystems IRIS 2020.1 Tech Talk: DevOps on June 2nd at 10:00 AM EDT!

In this InterSystems IRIS 2020.1 Tech Talk, we focus on DevOps. We'll talk about InterSystems System Alerting and Monitoring, which offers unified cluster monitoring in a single pane for all your InterSystems IRIS instances. It is built on Prometheus and Grafana, two of the most respected open source offerings available.

Next, we'll dive into the InterSystems Kubernetes Operator, a special controller for Kubernetes that streamlines InterSystems IRIS deployments and management. It's the easiest way to deploy an InterSystems IRIS cluster on-prem or in the Cloud, and we'll show how you can configure mirroring, ECP, sharding and compute nodes, and automate it all.

Finally, we'll discuss how to speed test InterSystems IRIS using the open source Ingestion Speed Test. This tool is available on InterSystems Open Exchange for your own testing and benchmarking.

4 6
1 522

Hi All,

With this article, I would like to show you how easily and dynamically System Alerting and Monitoring (or SAM for short) can be configured. The use case could be that of a fast and agile CI/CD provisioning pipeline where you want to run your unit-tests but also stress-tests and you would want to quickly be able to see if those tests are successful or how they are stressing the systems and your application (the InterSystems IRIS backend SAM API is extendable for your APM implementation).

4 0
1 639

When you have been using cubes for business intelligence in a namespace for some time, you may find that there are many cubes in the namespace, only some of which are actively being used. However, it can be difficult to tell which cubes users are or are not querying, and maintaining unused cubes can be costly both in terms of storage and of computation to keep them up to date. This article provides some suggestions and examples for monitoring which cubes are in active use, and for removing cubes that you determine are no longer necessary.

4 2
2 400

Hey Developers,

Check out the latest video on FHIR API Management:

FHIR API Management: Basic Configuration

https://www.youtube.com/embed/EYZ4dXNZNSY
[This is an embedded link, but you cannot view embedded content directly on the site because you have declined the cookies necessary to access it. To view embedded content, you would need to accept all cookies in your Cookies Settings]

FHIR API Management: FHIR Dev Portal

https://www.youtube.com/embed/9yEm7ZAZENI
[This is an embedded link, but you cannot view embedded content directly on the site because you have declined the cookies necessary to access it. To view embedded content, you would need to accept all cookies in your Cookies Settings]

FHIR API Management: Logging and Monitoring

https://www.youtube.com/embed/xcHjcBTLw8o
[This is an embedded link, but you cannot view embedded content directly on the site because you have declined the cookies necessary to access it. To view embedded content, you would need to accept all cookies in your Cookies Settings]

FHIR API Management: Security

https://www.youtube.com/embed/7ImJPCdp96A
[This is an embedded link, but you cannot view embedded content directly on the site because you have declined the cookies necessary to access it. To view embedded content, you would need to accept all cookies in your Cookies Settings]

3 0
0 362
Article
· Aug 2, 2020 1m read
Application Errors Analytics

Hi Developers!

As you know the application errors live in ^ERRORS global. They appear there if you call:

d e.Log() 

in a Catch section of Try-Catch.

With @Robert Cemper's approach, you can now use SQL to examine it.

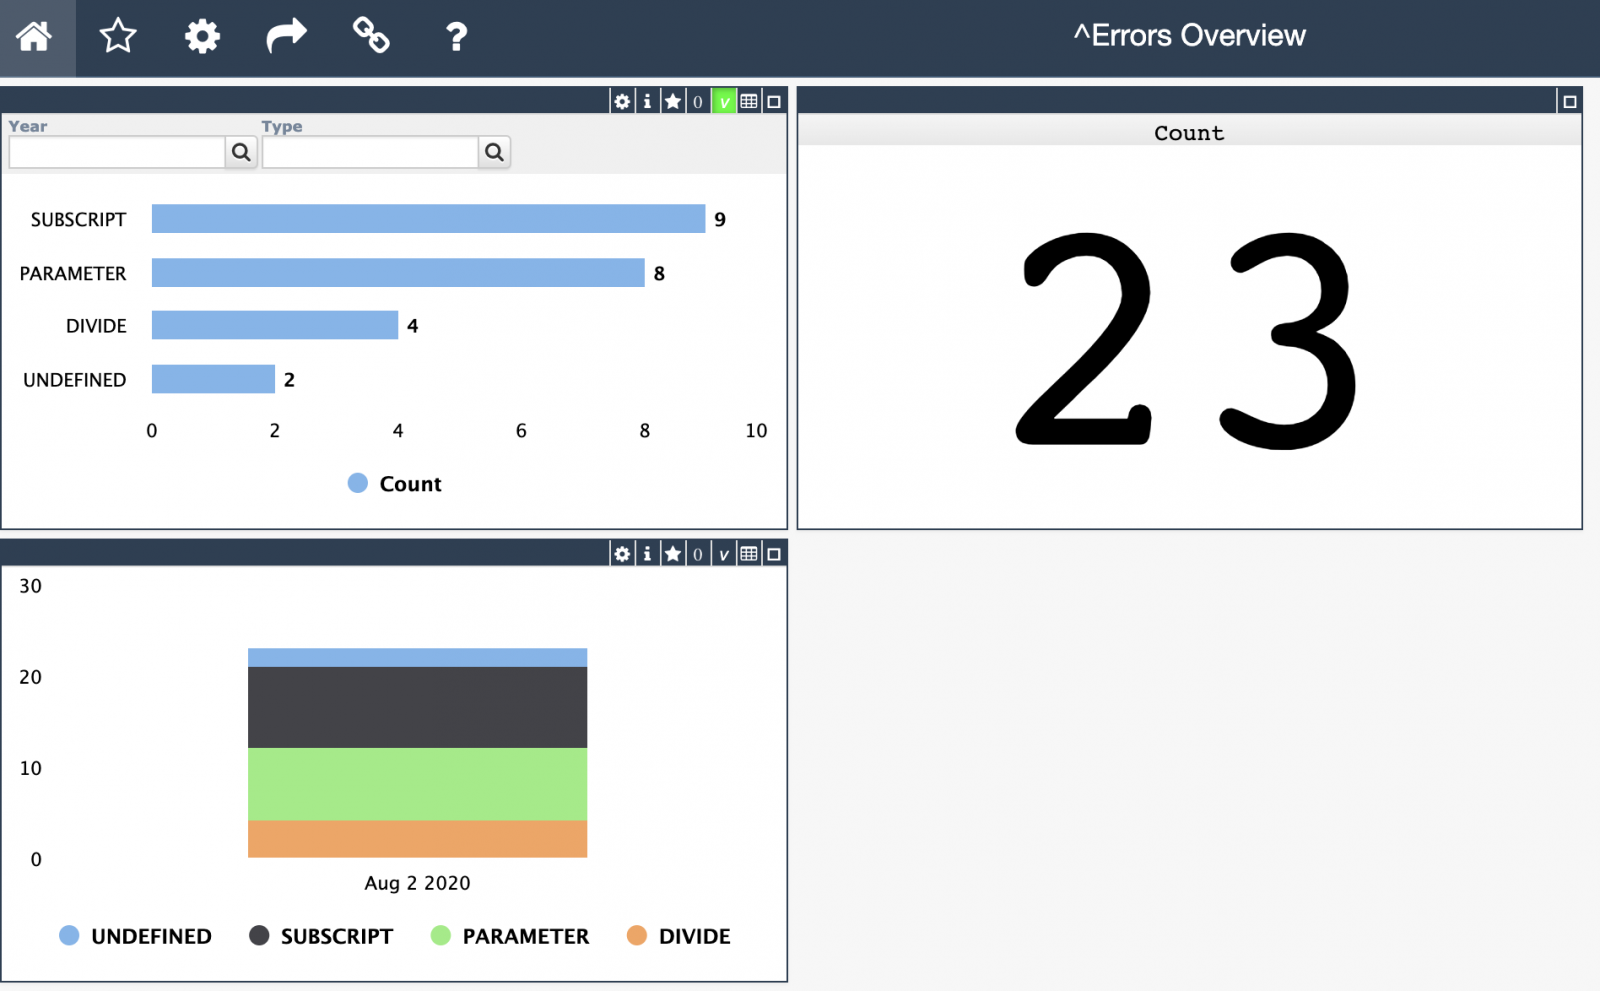
Inspired by Robert's module I introduced a simple IRIS Analytics module which shows these errors in a dashboard:

3 5
1 294

Some Usage cases

1. A deployment may consist of two high availability instances and two disaster recovery instances in a different data center.

The corresponding UAT environment could replicate this giving a total of 8 instances. How do you confirm CPF and Scheduled task alignment across ALL instances.

3 2
0 304
Article
· Feb 3, 2023 3m read
Queue monitoring

Overview

With the gradual improvement of hospital information construction, there are more and more business interfaces in hospitals. Due to the influence of various factors (network, consumer system, etc.), the data processing of business interface may cause excessive message accumulation and even the situation of interface card congestion, which affects the normal business development in the hospital. Therefore, the monitoring of the queue of business interface components becomes more and more important.

3 2
0 367

Hey Developers,

Please welcome the new video on InterSystems Developers YouTube:

System Alerting & Monitoring

https://www.youtube.com/embed/EYLHIEAxHLk
[This is an embedded link, but you cannot view embedded content directly on the site because you have declined the cookies necessary to access it. To view embedded content, you would need to accept all cookies in your Cookies Settings]

3 0
1 299

Hi all,

I recently discovered the Monitoring Activity Volume feature in IRIS and I was amazed by it. So, I put it to work in one of our productions. It is nice how easy it is to set up and all the possibilites that came with it.

But there's something weird: the numbers. Actually, one of the BP is stating a time of more than 6 seconds to process:

2 6
1 324

The MONITOR process (also called the Caché Monitor) scans the messages in your cconsole.log file and sends you emails based on the severity of those messages. The MONITOR is configured using the ^MONMGR utility in terminal.

The MONITOR should not be confused with the similarly named System Monitor, which checks a variety of system health and performance metrics and can log messages regarding them to the cconsole.log, where they can then be scanned by the MONITOR.

2 6
1 1.3K

Hi Community!

Please find the Developer Community video of the week:

Monitoring : Don't Turn a Drama into a Crisis

https://www.youtube.com/embed/T_RK5QzRZ0Q
[This is an embedded link, but you cannot view embedded content directly on the site because you have declined the cookies necessary to access it. To view embedded content, you would need to accept all cookies in your Cookies Settings]

2 0
0 279

Please excuse my ignorance. I am trying to identify what areas would be best to review in the System Dashboard (for Cache 2010.2) for performance issues with the database. It seems to be running slower than usual, but I am trying to find out the best way to go about identifying what the issue is.

The following are captures from the System Dashboard.

As always, thanks a lot for your help.

System Dashboard

2 3
0 550
Question
· Oct 20, 2016
%UnitTest Code Coverage

Hi,

When we write unit test cases for cache object script code using %UnitTest.TestCase, what is the best way to write code to identify code coverage?

So, let say my unit test case hit all 10 lines of code of a method for a given class. So, unit test coverage should be 100% for that. But, using line-by-line coverage [(%Monitor.System.LineByLine] getting wrong percentage, because it also includes code comment/documentation as part of code. So, practically we can not ever achieve 100% of code coverage by using this API.

2 2
0 749