Hi all,

I recently discovered the Monitoring Activity Volume feature in IRIS and I was amazed by it. So, I put it to work in one of our productions. It is nice how easy it is to set up and all the possibilites that came with it.

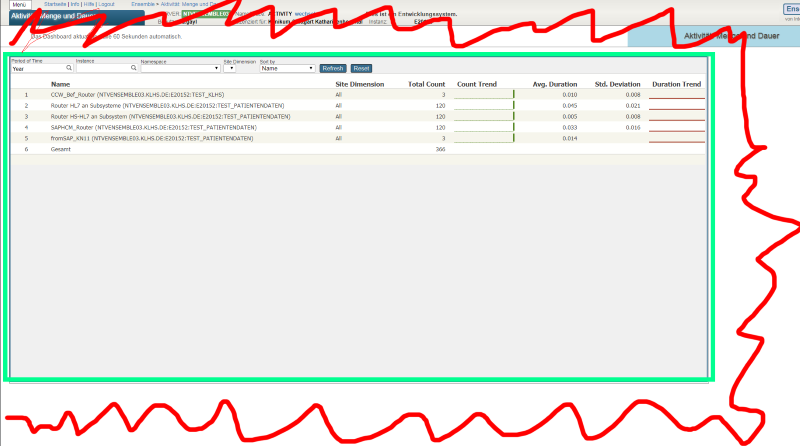
But there's something weird: the numbers. Actually, one of the BP is stating a time of more than 6 seconds to process:

2 6
1 386
Question
· Oct 20, 2016
%UnitTest Code Coverage

Hi,

When we write unit test cases for cache object script code using %UnitTest.TestCase, what is the best way to write code to identify code coverage?

So, let say my unit test case hit all 10 lines of code of a method for a given class. So, unit test coverage should be 100% for that. But, using line-by-line coverage [(%Monitor.System.LineByLine] getting wrong percentage, because it also includes code comment/documentation as part of code. So, practically we can not ever achieve 100% of code coverage by using this API.

2 2
0 866

Please excuse my ignorance. I am trying to identify what areas would be best to review in the System Dashboard (for Cache 2010.2) for performance issues with the database. It seems to be running slower than usual, but I am trying to find out the best way to go about identifying what the issue is.

The following are captures from the System Dashboard.

As always, thanks a lot for your help.

System Dashboard

2 3
0 591

We are running HealthShare on Linux Redhat via Azure.

A couple of days ago, the Azure server rebooted. Which we were unaware of.

Resulting in the Instance being in a downed status.

In the short term I put together a quick script to check the status, if it is down to restart it.

However, before I go down that road, I thought it would be best to inquire if there is a much better and more streamlined solution?

In a nutshell I just want to check and see if the Instance is up or in a state such as down or hung then start it.

1 2
0 509

Can Cache Monitor (^MONMGR) and System Monitor be configured to also send 'OK' messages? With the first bad email, you still wonder if things are still broken, when in-fact normalcy has been restored, some even within some seconds.

typical examples : -

------ - - - -- - - - -- - -- --- - -- -- -- - - - -- -- -- - --- - - - -- - - -- - - -- --- - - -- -- -- - - --- - - - - --- -- --- - - -- -- --- - - --- - --- -- - - -- -

Sent: Monday, 14 November 2016 11:51 AM

To: Email

1 1
1 1.7K

I need to develop a tool to help to get what data is being consumed by a certain process, in order to get all data used to build an automated test scenario.

For example, some user process will pull data from ^GLOBAL(1)="dataString", ^GLOBAL(2)="dataString2", ^GLOBAL1(1)="data1String", ^GLOBAL2(4)="data2String4". Amidst all other data on these Globals, I will ignore everything that was not used in the user process, and get the specific keys used on it.

1 12
0 449
Question
· May 9, 2016
Production Monitor

At the Global Summit several folks had mention that they developed their own production monitor. I am looking to create a monitor similar to eGate that we only display those Services/Processes/Operations that are in trouble, and those Errors that are showing up in the Event Log. Does anyone have any examples of this?

Thanks

Scott Roth

The Ohio State University Wexner Medical Center

0 3
1 662

Is it possible to dynamically adjust the RetryInterval andFailureTimeout settings in a BPL?

I've got a business process that calls a web service operation to get a session ID from an external system. There is a string property returned in the body of the response that indicate an exception occurred in the external system. I have code in the BPL that examines the property and sets the status property to an error status when that occurs.

0 3
0 784

I'm a DBA and support Caché databases on AIX. I coded shell scripts for monitoring journaling status, databases size, license end date.

We recently got a new instance of Caché on Windows. I'm just curious to know whether anyone coded database monitoring scripts on Windows using PowerShell or any other scripting language.

If yes, please share the details.

Thanks & Regards,

Bharath Nunepalli.

0 3
0 536

We have multiple implementations spanning many namespaces and edges. I would like to see if I could identify a single place, perhaps on HSREGISTRY or HSBUS, that I could capture certain events like searches (from all customers) and record transfers (with requester and provider).

The goal is to have a dashboard that would show simple stats such as searches by participant, records shared by participant and records consumed by participant. These are the 3 most important.

I appreciated the feedback on the other question of "how" but now I'm hoping to find the "Where".

0 1
0 408

I am looking for a database management tool I would have expected to find something like on the SMP website

Aim

show current database usage (ie size allocation) by database then table etc and allow continued drill down,

show information as a table, so can then sort by size to find the biggest item easily

also show it graphically

And then have ability to track and trend growth in size over time

identify a normal growth pattern

alert if variation (higher or lower) from normal based on recent trend

0 2
0 1.2K

We are constantly running into issues where there are billions of Orphaned messages in our system that cause problems, and we have to manually run a cleanup to fix performance issues.

In the following article about orphaned messages... https://community.intersystems.com/post/ensemble-orphaned-messages it mentions either programmatically eliminating the Orphaned messages or using a Utility like Demo.Util.CleanupSet in ENSDEMO.

0 7
2 875
Question
· Nov 9, 2017
Detecting and managing failover

I have Ensemble/Healthshare running in a production environment which is setup with a mirror failover and an arbiter sitting between them.

In the event of a failover we have a number of connections that need stopping/monitoring and starting in a certain order.

Is there a programmatic way we can detect the failover and stop certain services and operations immediately and then start them up again in the required order, checking their connection state before starting the next connection.

0 2
0 574

Off the back of the Interface Monitoring post I had created a class that queries the Ens.AlertRequest global and returns the entries between 6pm the night before and 6am in the morning.

I tested this build in our T&D environments and the build worked very well.

However in our production environment the query is being truncated, by what I believe to be a timeout and I get a partial query output.

In the System>SQL pages my 12 hour query times out.

0 5
0 252

Hi:

Currently we are using an older Healthshare instance but I am not opposed to using IRIS as we will upgrade eventually.

Currently for monitoring productions we have a Montior screen. We have both the Queues page and a Deepsee dashboard which has current status of our services. The issue with the Deepsee method we currently have with traffic lights is 1) the page is a bit slow to load the metrics 2) any new services from the team a new widget needs created and although this is easy enough to do it just is time consuming.

0 5
0 441

Hi all.

A long time ago I enabled Activity Monitoring to be able to save myself headaches in the future when looking at the performance of various message routes through our productions. It's served it's purpose of answering questions on how many messages we process a week etc but I had not had the chance to really dig down into the stats for specific message types or destinations to pin point issues.

0 3
0 303

As per the documentation of QueueCountAlert:
Number of messages on this item's queue needed to trigger an Alert message to be sent. Note that no further alerts will be sent unless the number of messages on the queue drops below 80% of this number and then rises again to this number.
Note that this alert will be sent even if AlertOnError is False.
Zero means no alerts of this type will be sent.

Now, the question is,
If QueueCountAlert is set to 10, and the queue size become 11 we will be getting email once.

0 6
0 521

I want to understand how this message is build:

[SYSTEM MONITOR] CPUusage Alert: CPUusage = 99, 99, 99 (Max value is 85).

Caché keep a log of cpu usage (99,99,99) and how is the frequency of check of this?

how can i chance the max value? is that possible?

Best,

0 4
0 928