 By likes
Please excuse my ignorance. I am trying to identify what areas would be best to review in the System Dashboard (for Cache 2010.2) for performance issues with the database. It seems to be running slower than usual, but I am trying to find out the best way to go about identifying what the issue is.
The following are captures from the System Dashboard.
As always, thanks a lot for your help.

.png)
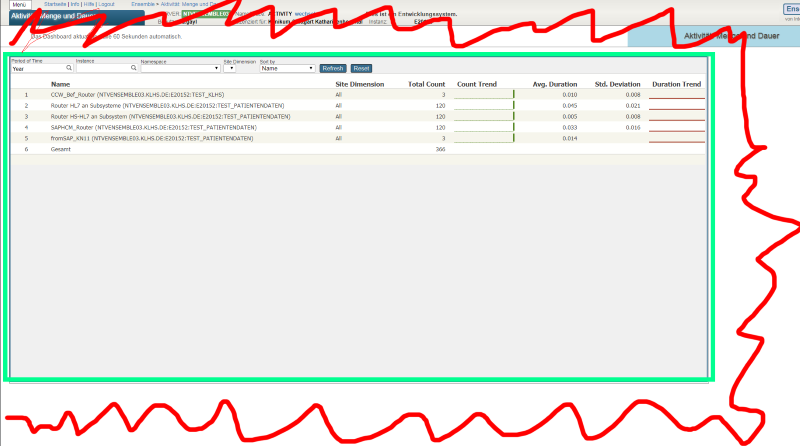
.png)