IRIS Queue monitoring component
1. Overview
With more and more hospital applications built, business interface data processing may be affected by a variety of factors (network, consumer systems, etc.), there is an excessive accumulation of messages or even cause interface lag, affecting the routine performance of hospital IT systems , so the monitoring of the business interface components queue is increasingly important.
While current Intersystems IRIS platform's built-in queue monitoring only displays real-time queue information for interface components, which is limited in providing the queue data information needed by hospitals. The queue monitoring component program is based on the Intersystems IRIS platform and can monitor all interface components and display component queue information within 24h of the component, as well as query component historical queue data by setting a time period to better meet the needs of current in-hospital applications.
- The Application
Functions & Features
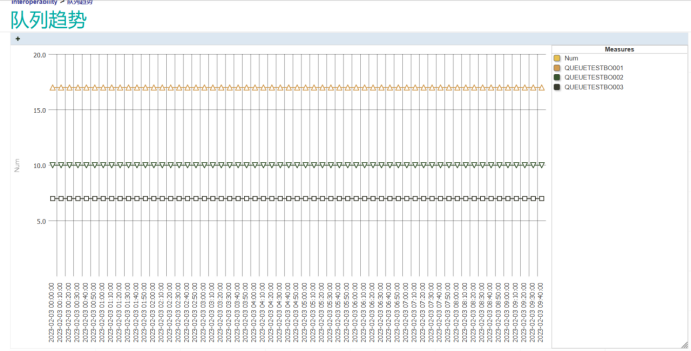
This application can monitor the Intersystems IRIS platform production running components of the message queue to achieve real-time unified monitoring functions, and display the current business interface components 24h queue trend situation, can also be displayed through the specified time range of historical queue trend situation, through the components of the historical queue data analysis of the current business interface components configuration is reasonable, whether the need for optimization It can analyze whether the current business interface component configuration is reasonable and needs to be optimized through component historical queue data; analyze the frequency of queue number generation through historical queue data trend; for incidents caused by queue problems, it can quickly locate the queue start time and business event ID through the trend graph, which reduces the incident investigation time and greatly improves the investigation efficiency.
Possible Use Cases in the future
- Intelligent optimization of component runtime pool configuration
- Queue monitoring alerts
- Top 5 Queue top5 highlighting
- Component queue issue frequency statistics
Installation and deployment
- Create a new namespace and production on the installed instance and import this application code
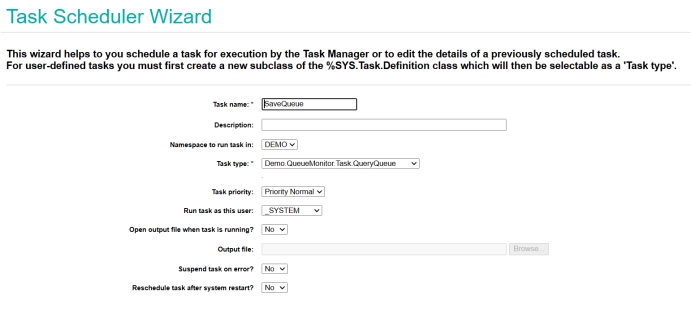
- Create a new scheduled task for the namespace to extract queue information
- Access the path to see the queue information, **** is the default application name of the namespace
http://ip:port/****/Demo.QueueMonitoringPage.cls
How to Use it
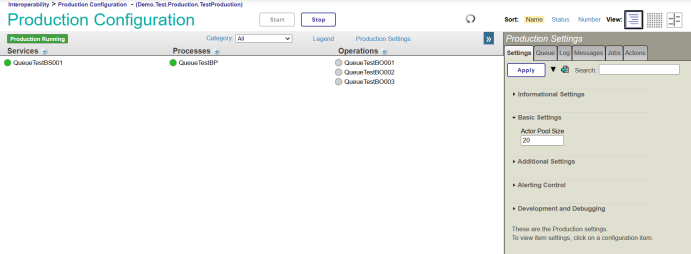
Prerequisites: The namespace needs to have an enabled production. if not, you can open the built-in production in the program code (Demo.Test.Production.TestProduction) and enable it.
QueryQueue class, and set it to run every 10 minutes to extract queue information.
Go to url(http://ip:port/****/Demo.QueueMonitoringPage.cls )and you can see the statistics.

If the current production has no queue information, you can view the demo data by running the code set ^QueueData=1. After viewing, Don't forget to execute set ^QueueData=0 after viewing. to reset it back to real-time data.
It's simple but very useful, pls vote for me. Thx!
Comments
Value==Simple+Useful, good work!