 By likes
 Open Exchange app
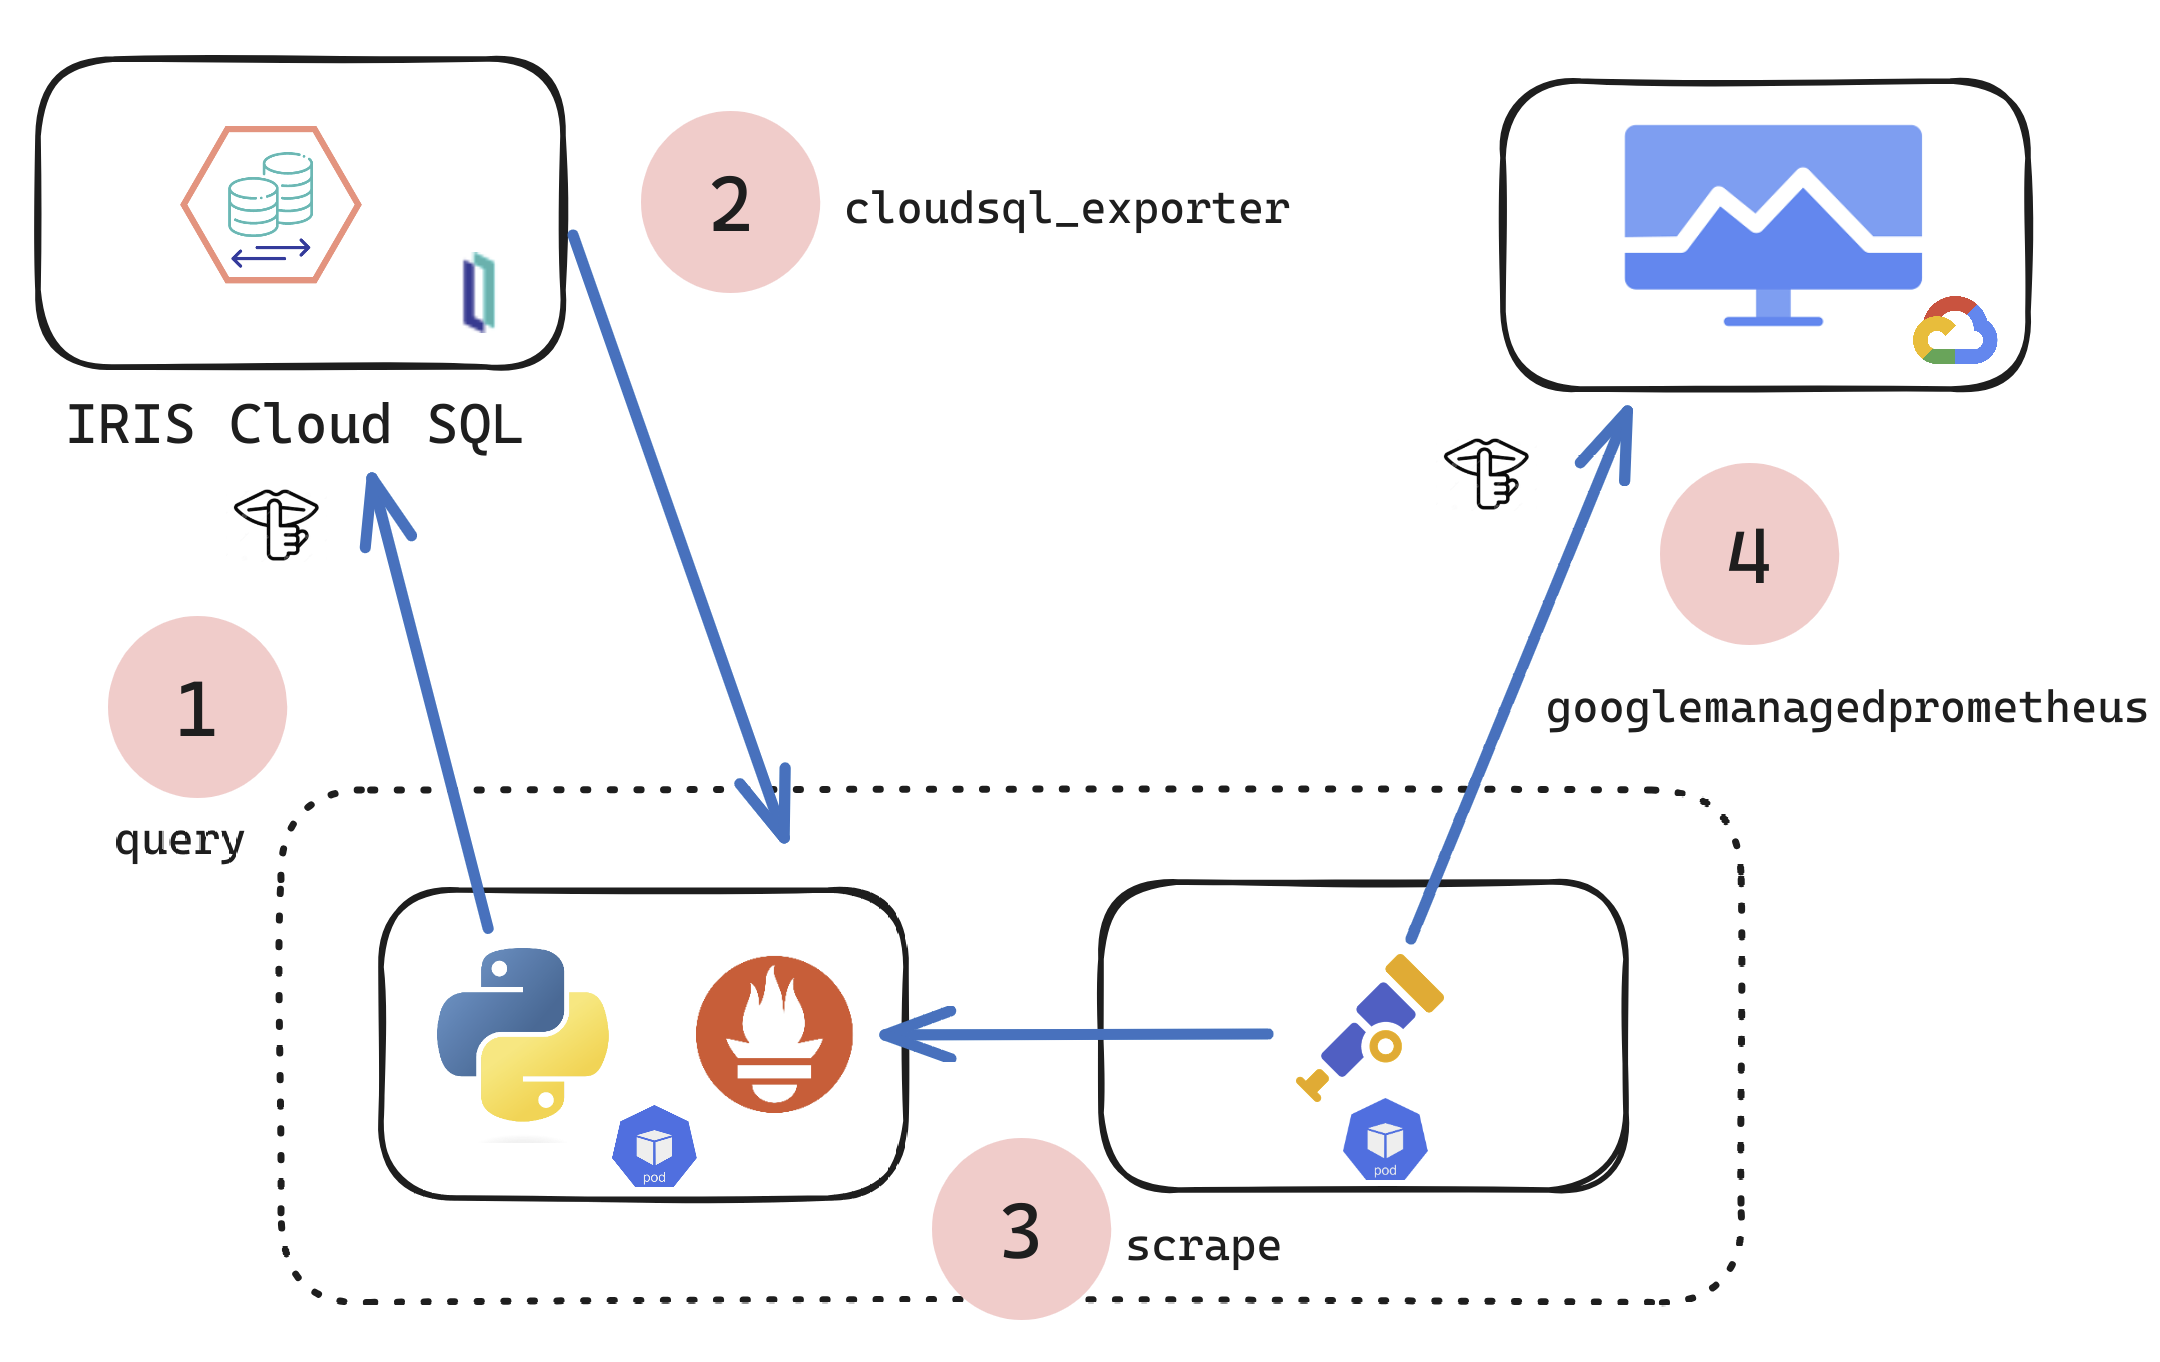
Monitoring your IRIS deployment is crucial. With the deprecation of System Alert and Monitoring (SAM), a modern, scalable solution is necessary for real-time insights, early issue detection, and operational efficiency. This guide covers setting up Prometheus and Grafana in Kubernetes to monitor InterSystems IRIS effectively.
This guide assumes you already have an IRIS cluster deployed using the InterSystems Kubernetes Operator (IKO), which simplifies deployment, integration and mangement.
.png)
.png)
.png)
.png)