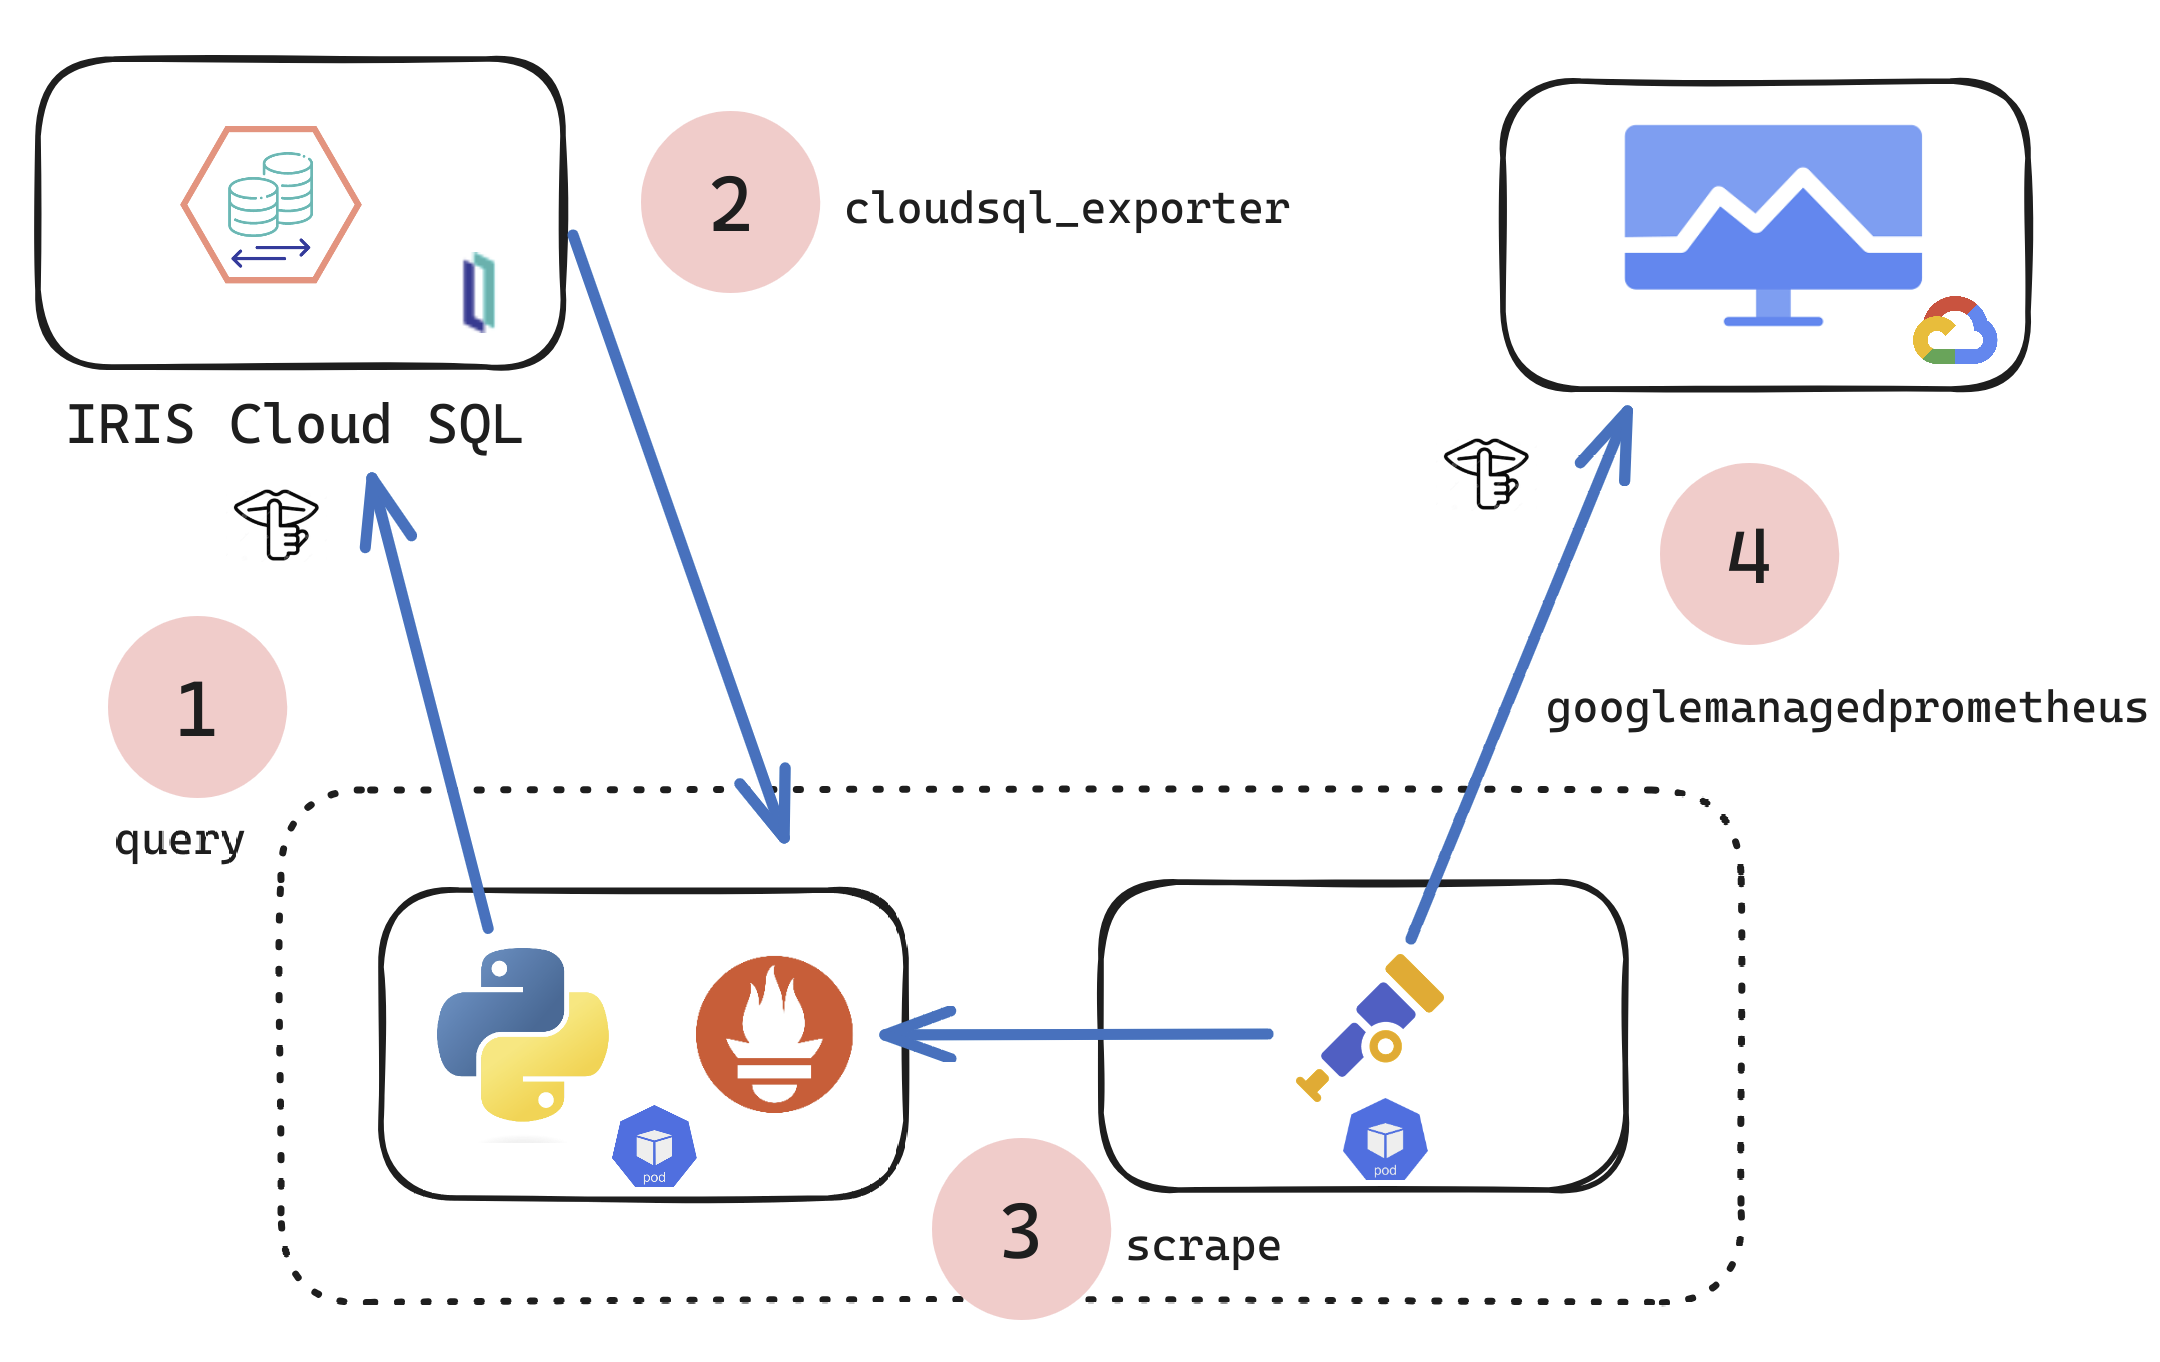
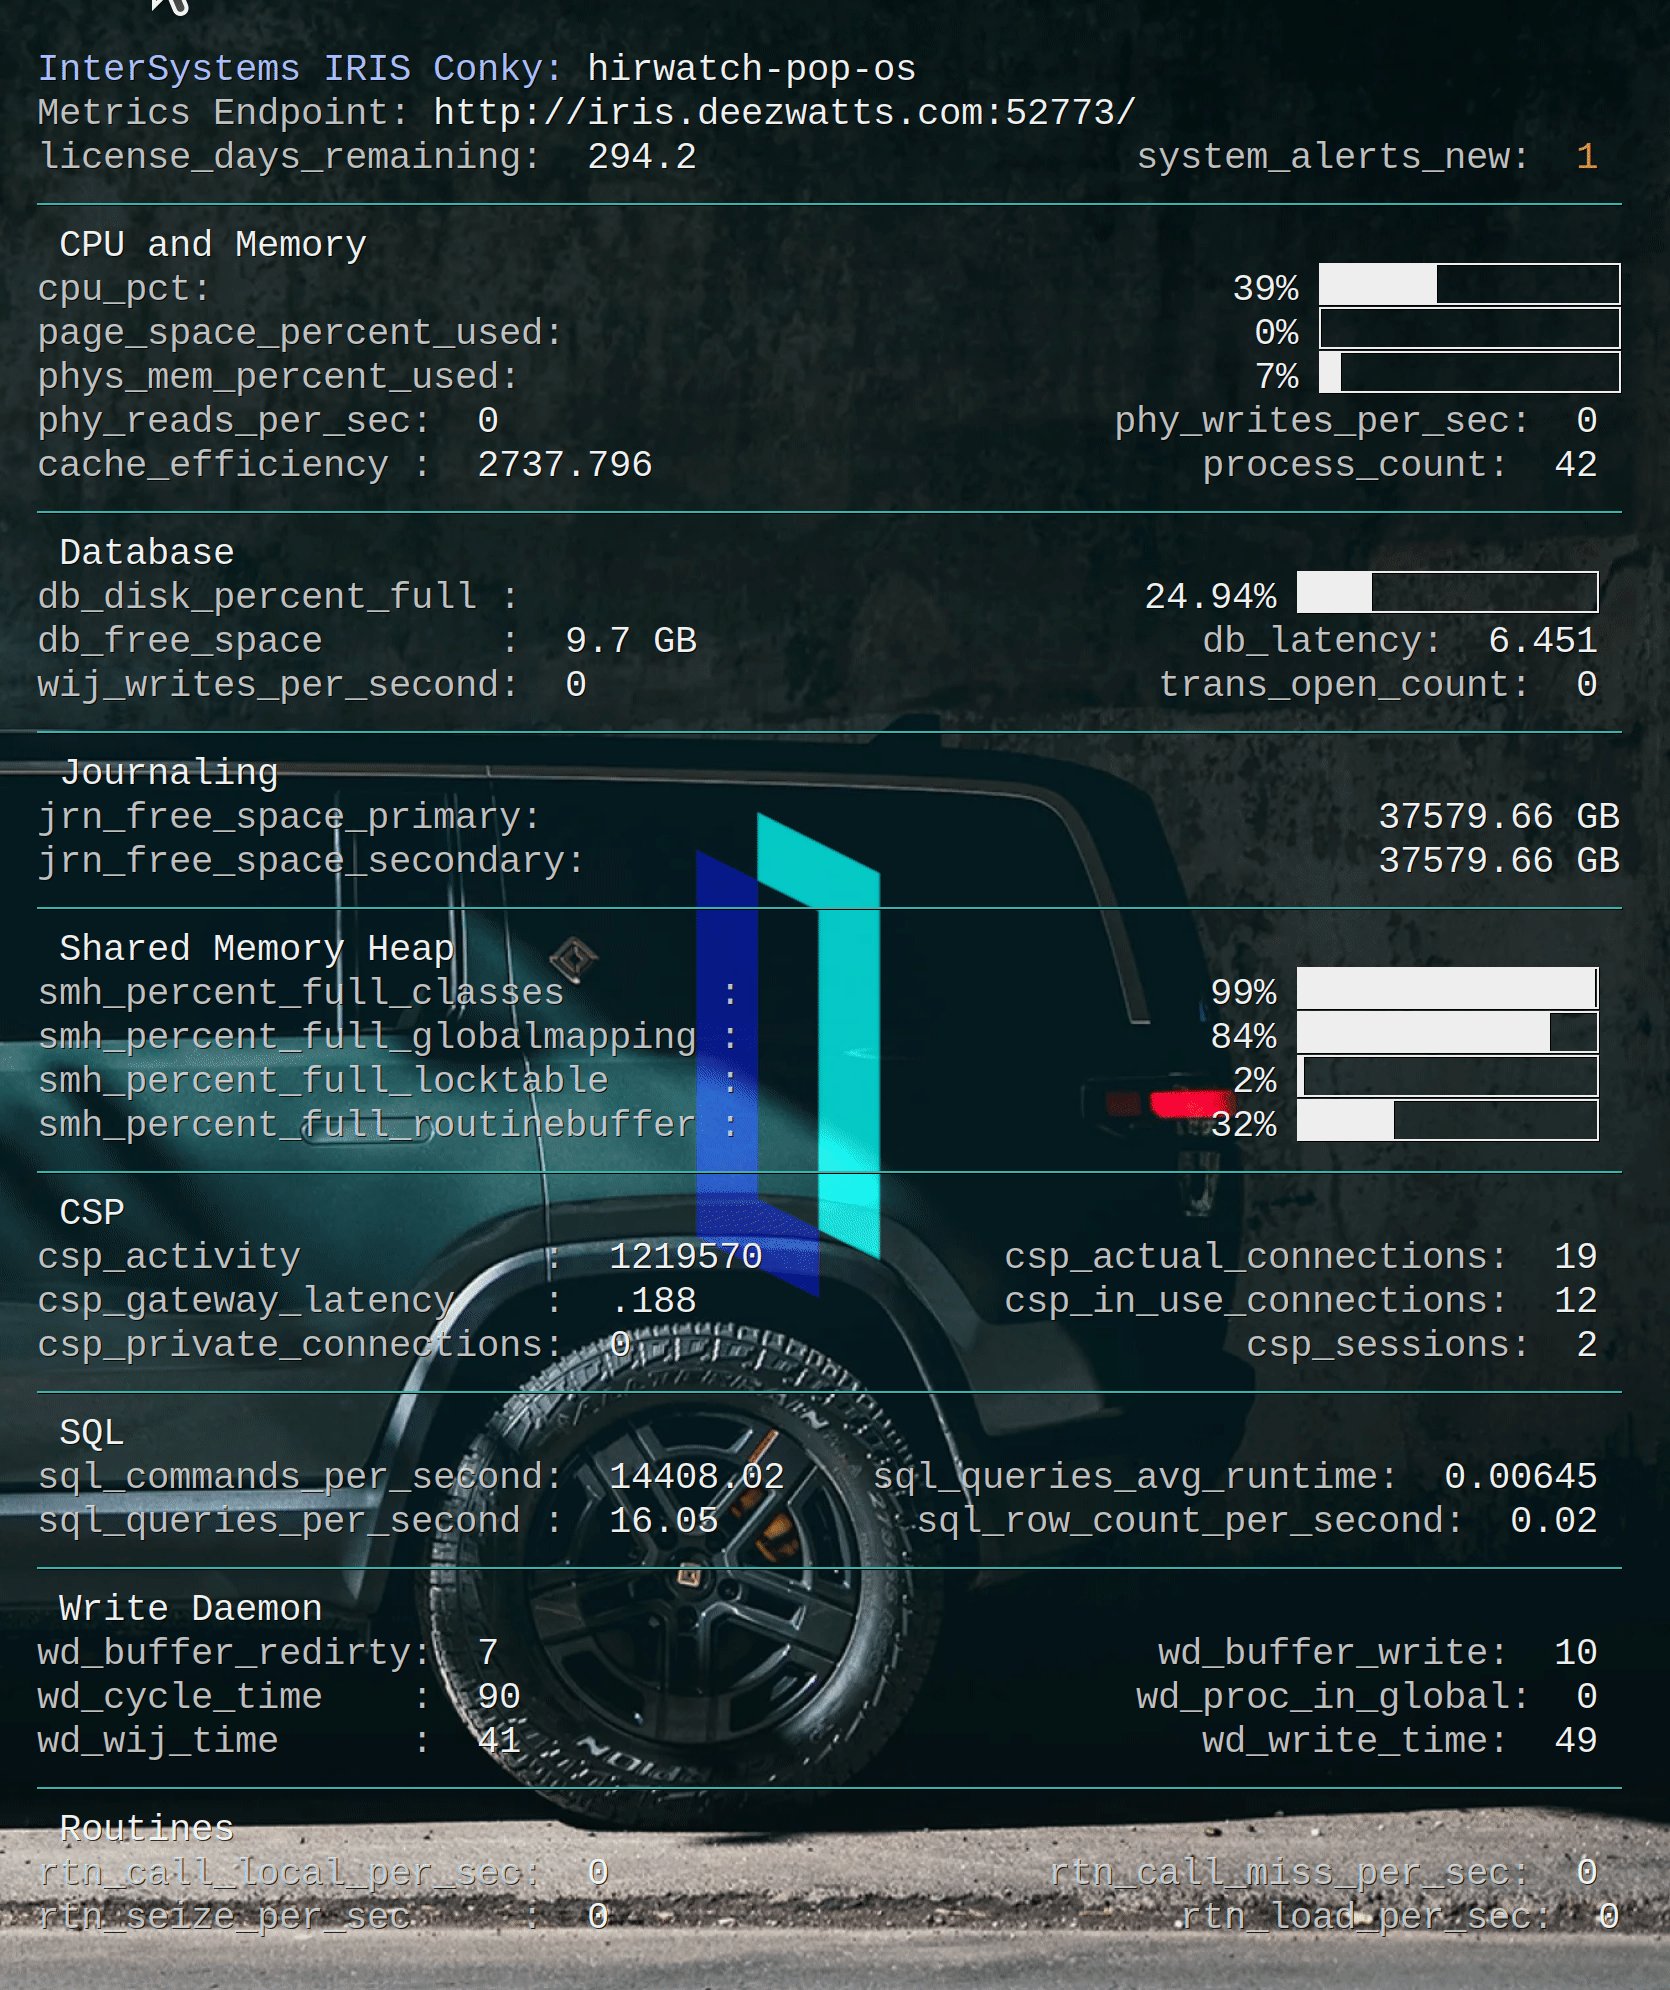
The following steps show you how to display a sample list of metrics available from the /api/monitor service.

In the last post, I gave an overview of the service that exposes IRIS metrics in Prometheus format. The post shows how to set up and run IRIS preview release 2019.4 in a container and then list the metrics.


This post assumes you have Docker installed. If not, go and do that now for your platform :)

16 10
5 944

In this post I would like to talk about the syslog table. I will cover what it is, how you look at it, what the entries really are, and why it may be important to you. The syslog table can contain important diagnostic information. If your system is having any problems, it is important to understand how to look at this table and what information is contained there.

15 1
1 2,100

Released with no formal announcement in IRIS preview release 2019.4 is the /api/monitor service exposing IRIS metrics in Prometheus format. Big news for anyone wanting to use IRIS metrics as part of their monitoring and alerting solution. The API is a component of the new IRIS System Alerting and Monitoring (SAM) solution that will be released in an upcoming version of IRIS.

11 2
7 1,512
Article
· Aug 26, 2016 8m read
Enterprise Monitor and HealthShare

Enterprise Monitor is a component of Ensemble and can help organizations monitor multiple productions running on different namespaces within the same instance or namespaces running on multiple instances.

Documentation can be found at:

http://docs.intersystems.com/ens20161/csp/docbook/DocBook.UI.Page.cls?KEY=EMONITOR_all#EMONITOR_enterprise

In Ensemble 2016.1 there were changes made to make this utility work with HealthShare environments.

This article will:

  • Show how to set up Enterprise Monitor for HealthShare sites
  • Show some features of Enterprise Monitor
  • Show some features of Enterprise Message Viewer

For this article, I used the following version of HealthShare:

Cache for Windows (x86-64) 2016.1 (Build 656U) Fri Mar 11 2016 17:42:42 EST [HealthShare Modules:Core:14.02.2415 + Linkage Engine:14.02.2415 + Patient Index:14.02.2415 + Clinical Viewer:14.02.2415 + Active Analytics:14.02.2415]

10 2
0 1,249
Article
· Feb 13, 2017 14m read
Creating custom SNMP OIDs

This post is dedicated to the task of monitoring a Caché instance using SNMP. Some users of Caché are probably doing it already in some way or another. Monitoring via SNMP has been supported by the standard Caché package for a long time now, but not all the necessary parameters are available “out of the box”. For example, it would be nice to monitor the number of CSP sessions, get detailed information about the use of the license, particular KPI’s of the system being used and such. After reading this article, you will know how to add your parameters to Caché monitoring using SNMP.

10 14
2 10,486
Article
· Feb 25, 2019 4m read
Using Grafana directly from IRIS

There have been some very helpful articles in the community that show how to use Grafana with IRIS (or Cache/Ensemble) by using an intermediate database.

But I wanted to get at IRIS structures directly. In particular, i wanted to access the Cache History monitor data that is accessible by SQL as described here

https://community.intersystems.com/post/apm-using-cach%C3%A9-history-mon...

and didn't want anything between me and the data.

9 5
4 1,190
Article
· Dec 22, 2016 2m read
The Polymetric Dashboard

> Customizable System Monitoring. ## Introduction The Polymetric Dashboard is a stand-alone module that provides enhanced monitoring tools for a Caché environment. Equipped with over one hundred sensors that monitor key system metrics, a robust REST API, and a modular AngularJS user interface, the Polymetric Dashboard is fully functional out of the box. However, the Polymetric Dashboard is designed to be customizable; any system metric can be monitored by creating a new sensor, and the visualization of collected data can be tailored to specific requirements and purposes.

9 20
1 1,479

From time to time, we get the previous question in support, something or someone is using more licenses than expected, and we need to find what.

We have two scenarios. The first scenario is when we realize that the licenses are exhausted when the application does not work or when we try to connect through the terminal and get the "lovely"

<LICENSE LIMIT EXCEEDED> message:

7 1
0 410

Hi Community,

This article assumes that you are familiar with Zabbix and SNMP monitoring, if not, there are some very interesting posts on the Community, especially this one (https://community.intersystems.com/post/creating-custom-snmp-oids) which contains a lot of information on how to configure and request an SNMP Cache server.

6 0
0 5,924

APM normally focuses on the activity of the application but gathering information about system usage gives you important background information that helps understand and manage the performance of your application so I am including the IRIS History Monitor in this series.

In this article I will briefly describe how you start the IRIS or Caché History Monitor to build a record of the system level activity to go with the application activity and performance information you gather. I will also give examples of SQL to access the information.

6 3
2 1,469
Article
· Jul 12, 2019 2m read
Basic Database Metrics example

This is a self contained class that can be run from the Intersystems Task Scheduler which records peak usage details for databases and licenses built up throughout the day and retaining 30 days history.

To schedule the task to run every hour:

d ##class(Metrics.Task).Schedule()

You can also specify your own start time, stop time, and run interval:

d ##class(Metrics.Task).Schedule(startTime, stopTime, intervalMins)

Metrics are stored in ^Metrics in the namespace that the class resides in/is run from.

6 3
3 468
Article
· Jun 9, 2016 1m read
Ensemble monitoring

First post! In order to somewhat redeem myself for an unnecessary call to support, I've decided to post some classes that I've written to monitor certain metrics inside our Ensemble Live instance (yeah, Kyle, you WERE laughing at me, but it's okay). What the classes do is to run queries and code to get database sizes, status of the mirror, counts of rows in tables such as EnsLib.HL7.Message and Ens.MessageHeader. The data is collected and written to tables and then an email is sent out daily upon completion. I've found this quite useful in keeping an eye on what's going on. It's help

5 5
1 844

One of the topics that comes up often when managing Ensemble productions is disk space:

The database (the CACHE.DAT file) grows in a rate that was unexpected; or the Journal files build up at a fast pace; or the database grows continuously though the system has a scheduled purge of the Ensemble runtime data.

It would have been better if these kind of phenomena would have been observed and accounted for yet at the development and testing stage rather than on a live system.

For this purpose I created a basic framework that could aid in this task.

4 7
2 1,174

When you have been using cubes for business intelligence in a namespace for some time, you may find that there are many cubes in the namespace, only some of which are actively being used. However, it can be difficult to tell which cubes users are or are not querying, and maintaining unused cubes can be costly both in terms of storage and of computation to keep them up to date. This article provides some suggestions and examples for monitoring which cubes are in active use, and for removing cubes that you determine are no longer necessary.

4 2
1 320