IRIS iRacing
Hello IRIS Fans and Welcome to IRIS iRacing!
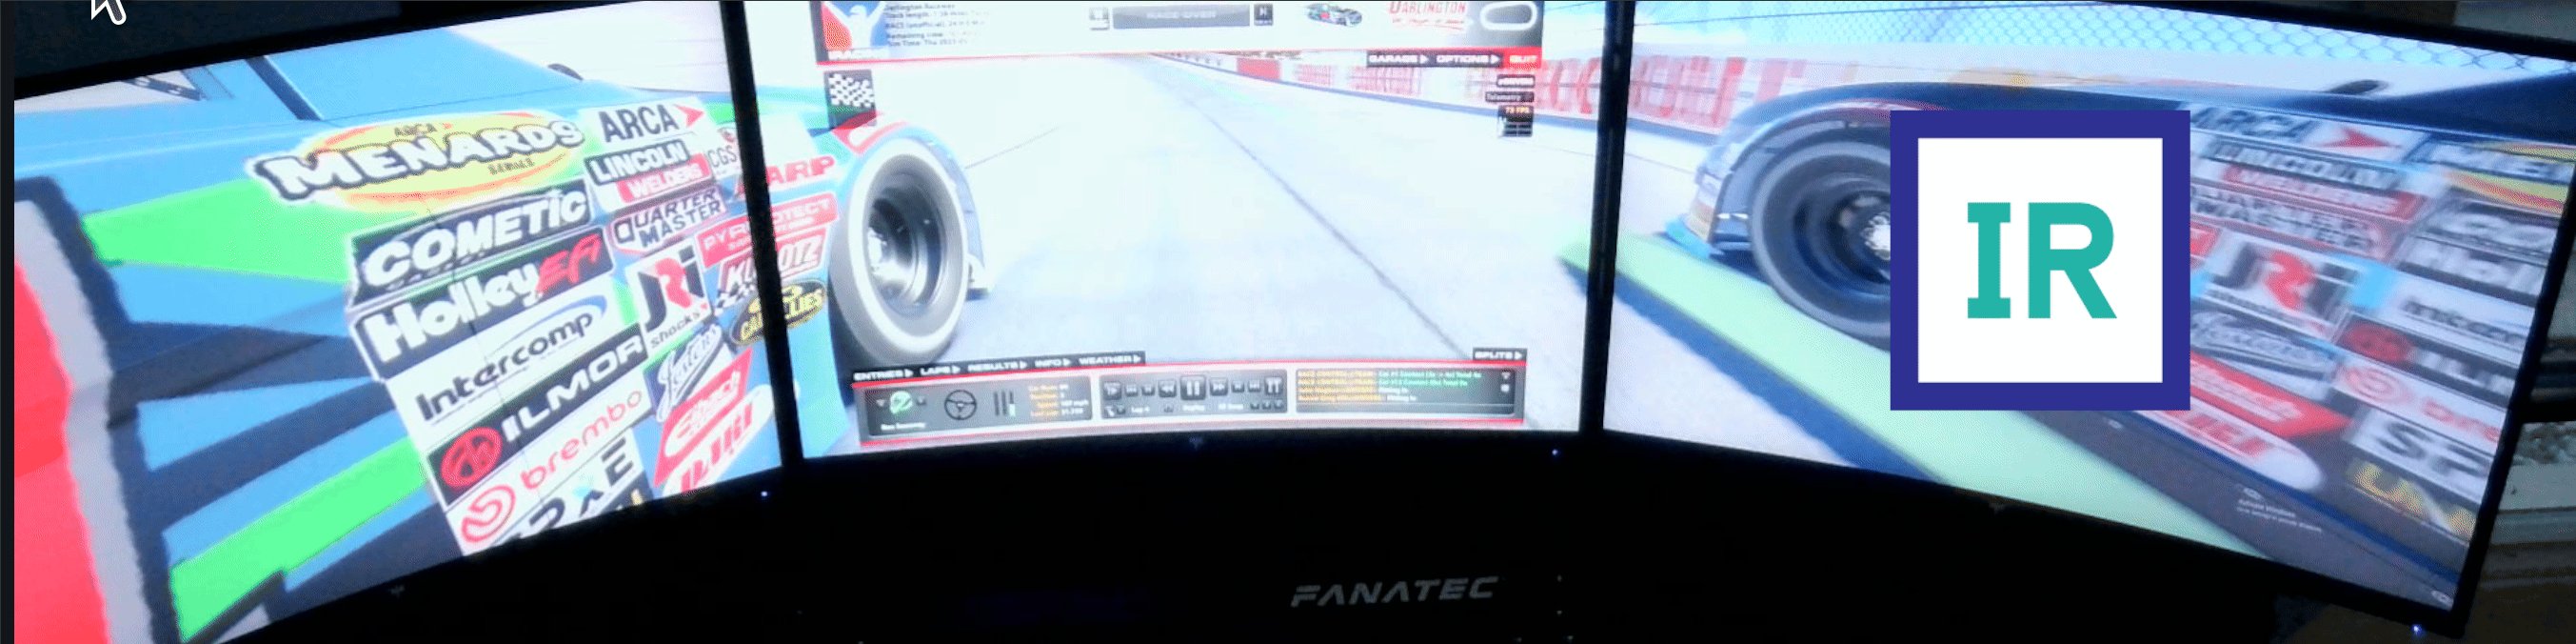
Here were going to take 3 laps of your time and demonstrate how I wired up my Racing SIM to IRIS for "As Real Time as It Gets" Metrics reporting. I missed the window for the contest, which happens quite often, but I still ended up 3rd I think in the demo race in the video below.
Technical Salad
Below are the technical ingredients for this demonstration for a salad you can post on Instragram.

- Python iRacing SDK ( https://github.com/kutu/
pyirsdk/tree/master ) - InterSystems IRIS Community / Python Interop
- Prometheus
- Grafana
- Custom Metric Class
User.iRacing.cls
Dont forget to do a:
set tSC = ##class(SYS.Monitor.SAM.Config).AddApplicationClass("User.iRacing", "USER")Then you should see your new metrics on the /api/monitor/metrics endpoint.
.png)
Notable here is my python setup on Windows:
cpf
[config]
LibPath=
MaxServerConn=1
MaxServers=2
Path=
PythonPath=c:\Python\Python313\python.exe
PythonRuntimeLibrary=C:\Python\Python313\python313.dll
PythonRuntimeLibraryVersion=3.13
UUIDv1RandomMac=0
bbsiz=-1
console=,
iris_site.py
def set_site_path(platform_name):
    sys.path = sys.path + __sitegetsitepackages(['C:\\Python\Python313'])
    sys.path = sys.path + ["C:\\Python\Python313\\Lib"]
Racing SIM
Below is the SIM specifications, complete with Driver.
- Haptics Buttkicker ( https://thebuttkicker.com/
products/buttkicker-gamer-plus ) - Wheel Fanatec ( https://www.fanatec.com/us/en/
p/sim-racing-bundles/r2r_csl_ )dd_qr2_wrc_5nm_us/csl-dd-qr2- ready2race-wrc-bundle-5nm-us - NVIDIA 4080 ( https://www.nvidia.com/en-us/
geforce/graphics-cards/40- )series/rtx-4080-family/ - Rig Dardo ( https://www.amazon.com/dp/
B0DMNGF8X9?ref_=ppx_hzsearch_ )conn_dt_b_fed_asin_title_1 - Triples ( https://www.amazon.com/dp/
B0B398KZWJ?ref_=ppx_hzsearch_ )conn_dt_b_fed_asin_title_2&th= 1 - Driver @Ron Sweeney, 1st year competing, ARCA series, drives a number 64 Ford ( https://s100.iracing.com/wp-
content/uploads/2025/03/ARCA_ ), mostly ovals.25_Manual_V1.pdf
Gluing it all together, we have a rolling SIM emitting, scraping and serving up iRacing metrics suitable for real time display.
.png)
As Real Time as It Gets
The excuse I made for myself to derive some real value of sorts out of this was I have always wanted to be as agressive as possible with data reporting from the source to the exporter, clear through the Prometheus Scrape and the eventual dashboard. The python sdk is wicked fast, as it reads from a memory mapped file while in session, and the other components can be configured to be agressive, but just are not by default and took some edits and daemon reloads.
In order to make this work, I found the following tweaks for necessary:
grafani.ini
min_refresh_interval = 1s
prometheus.yml
1s scrape
  - job_name: 'iracing'     # Override the global default and scrape targets from this job every 5 seconds.
    scrape_interval: 1s
    scrape_timeout: 1s     # metrics_path defaults to '/metrics'
    # scheme defaults to 'http'.
    static_configs:
      - targets: ['192.168.1.193:52773']
    metrics_path: '/api/monitor/metrics'
Dashboard
Newly added refresh rate can be added, and "Refresh Live Dashboards" should be enabled.
.png)
At rest it doesnt look like much, as its designed to be real time, but a screenshot is in order to see the 5 panels.
.png)
Grafana Dash
{
  "annotations": {
    "list": [
      {
        "builtIn": 1,
        "datasource": {
          "type": "grafana",
          "uid": "-- Grafana --"
        },
        "enable": true,
        "hide": true,
        "iconColor": "rgba(0, 211, 255, 1)",
        "name": "Annotations & Alerts",
        "type": "dashboard"
      }
    ]
  },
  "editable": true,
  "fiscalYearStartMonth": 0,
  "graphTooltip": 0,
  "id": 1,
  "links": [],
  "liveNow": true,
  "panels": [
    {
      "datasource": {
        "type": "prometheus",
        "uid": "fekvb739xgqo0c"
      },
      "fieldConfig": {
        "defaults": {
          "decimals": 0,
          "fieldMinMax": false,
          "mappings": [],
          "thresholds": {
            "mode": "absolute",
            "steps": [
              {
                "color": "green"
              },
              {
                "color": "red",
                "value": 160
              }
            ]
          },
          "unit": "none"
        },
        "overrides": []
      },
      "gridPos": {
        "h": 15,
        "w": 15,
        "x": 0,
        "y": 0
      },
      "id": 1,
      "options": {
        "allowNeedleCrossLimits": true,
        "animateNeedleValueTransition": true,
        "animateNeedleValueTransitionSpeed": 800,
        "edgeWidth": 0.05,
        "gaugeRadius": 0,
        "innerColor": "#000000",
        "markerEndEnabled": false,
        "markerEndShape": "arrow",
        "markerStartEnabled": false,
        "markerStartShape": "circle",
        "maxNeedleAngle": 320,
        "maxTickAngle": 300,
        "maxValue": 200,
        "minValue": 0,
        "needleColor": "orange",
        "needleCrossLimitDegrees": 10,
        "needleLengthNeg": 0,
        "needleTickGap": 0.05,
        "needleWidth": 5,
        "operatorName": "last",
        "outerEdgeColor": "#0099cc",
        "padding": 0.05,
        "pivotColor": "#999999",
        "pivotRadius": 0.1,
        "showThresholdBandLowerRange": true,
        "showThresholdBandMiddleRange": true,
        "showThresholdBandOnGauge": true,
        "showThresholdBandUpperRange": true,
        "showThresholdStateOnBackground": false,
        "showThresholdStateOnValue": false,
        "tickEdgeGap": 0.05,
        "tickFont": "Inter",
        "tickLabelColor": "text",
        "tickLabelFontSize": 10,
        "tickLengthMaj": 0.15,
        "tickLengthMin": 0.05,
        "tickMajorColor": "#0099CC",
        "tickMapConfig": {
          "tickMaps": []
        },
        "tickMinorColor": "#000000",
        "tickSpacingMajor": 10,
        "tickSpacingMinor": 1,
        "tickWidthMajor": 5,
        "tickWidthMinor": 1,
        "ticknessGaugeBasis": 200,
        "unitsLabelColor": "#1690c4",
        "valueFont": "Inter",
        "valueFontSize": 60,
        "valueYOffset": 0,
        "zeroNeedleAngle": 40,
        "zeroTickAngle": 60
      },
      "pluginVersion": "2.0.1",
      "targets": [
        {
          "datasource": {
            "type": "prometheus",
            "uid": "fekvb739xgqo0c"
          },
          "disableTextWrap": false,
          "editorMode": "builder",
          "expr": "iracing_speed{job=\"iracing\"}",
          "fullMetaSearch": false,
          "includeNullMetadata": true,
          "legendFormat": "__auto",
          "range": true,
          "refId": "A",
          "useBackend": false
        }
      ],
      "title": "IRIS iRacing",
      "transparent": true,
      "type": "briangann-gauge-panel"
    },
    {
      "datasource": {
        "type": "prometheus",
        "uid": "fekvb739xgqo0c"
      },
      "fieldConfig": {
        "defaults": {
          "color": {
            "mode": "thresholds"
          },
          "mappings": [],
          "thresholds": {
            "mode": "absolute",
            "steps": [
              {
                "color": "green"
              },
              {
                "color": "red",
                "value": 5000
              }
            ]
          }
        },
        "overrides": []
      },
      "gridPos": {
        "h": 8,
        "w": 9,
        "x": 15,
        "y": 0
      },
      "id": 3,
      "options": {
        "displayMode": "gradient",
        "legend": {
          "calcs": [],
          "displayMode": "list",
          "placement": "bottom",
          "showLegend": false
        },
        "maxVizHeight": 300,
        "minVizHeight": 16,
        "minVizWidth": 8,
        "namePlacement": "auto",
        "orientation": "auto",
        "reduceOptions": {
          "calcs": [
            "lastNotNull"
          ],
          "fields": "",
          "values": false
        },
        "showUnfilled": true,
        "sizing": "auto",
        "valueMode": "color"
      },
      "pluginVersion": "11.6.1",
      "targets": [
        {
          "disableTextWrap": false,
          "editorMode": "builder",
          "expr": "iracing_rpm",
          "fullMetaSearch": false,
          "includeNullMetadata": true,
          "legendFormat": "__auto",
          "range": true,
          "refId": "A",
          "useBackend": false
        }
      ],
      "title": "IRIS iRacing RPM",
      "transparent": true,
      "type": "bargauge"
    },
    {
      "datasource": {
        "type": "prometheus",
        "uid": "fekvb739xgqo0c"
      },
      "fieldConfig": {
        "defaults": {
          "color": {
            "mode": "thresholds"
          },
          "mappings": [
            {
              "options": {
                "0": {
                  "color": "dark-green",
                  "index": 0,
                  "text": "Open"
                },
                "1": {
                  "color": "dark-red",
                  "index": 1,
                  "text": "Brake"
                }
              },
              "type": "value"
            }
          ],
          "max": 1,
          "min": 0,
          "thresholds": {
            "mode": "absolute",
            "steps": [
              {
                "color": "green"
              },
              {
                "color": "red",
                "value": 1
              }
            ]
          }
        },
        "overrides": []
      },
      "gridPos": {
        "h": 7,
        "w": 6,
        "x": 15,
        "y": 8
      },
      "id": 4,
      "options": {
        "colorMode": "background_solid",
        "graphMode": "area",
        "justifyMode": "auto",
        "orientation": "auto",
        "percentChangeColorMode": "standard",
        "reduceOptions": {
          "calcs": [
            "lastNotNull"
          ],
          "fields": "",
          "values": false
        },
        "showPercentChange": false,
        "textMode": "auto",
        "wideLayout": true
      },
      "pluginVersion": "11.6.1",
      "targets": [
        {
          "disableTextWrap": false,
          "editorMode": "builder",
          "expr": "iracing_brake",
          "fullMetaSearch": false,
          "includeNullMetadata": true,
          "legendFormat": "__auto",
          "range": true,
          "refId": "A",
          "useBackend": false
        }
      ],
      "title": "IRIS iRacing Brake",
      "transparent": true,
      "type": "stat"
    },
    {
      "datasource": {
        "type": "prometheus",
        "uid": "fekvb739xgqo0c"
      },
      "fieldConfig": {
        "defaults": {
          "color": {
            "mode": "thresholds"
          },
          "mappings": [],
          "thresholds": {
            "mode": "absolute",
            "steps": [
              {
                "color": "green"
              },
              {
                "color": "red",
                "value": 80
              }
            ]
          }
        },
        "overrides": []
      },
      "gridPos": {
        "h": 7,
        "w": 3,
        "x": 21,
        "y": 8
      },
      "id": 5,
      "options": {
        "colorMode": "value",
        "graphMode": "area",
        "justifyMode": "auto",
        "orientation": "auto",
        "percentChangeColorMode": "standard",
        "reduceOptions": {
          "calcs": [
            "lastNotNull"
          ],
          "fields": "",
          "values": false
        },
        "showPercentChange": false,
        "textMode": "auto",
        "wideLayout": true
      },
      "pluginVersion": "11.6.1",
      "targets": [
        {
          "disableTextWrap": false,
          "editorMode": "builder",
          "expr": "iracing_gear",
          "fullMetaSearch": false,
          "includeNullMetadata": true,
          "legendFormat": "__auto",
          "range": true,
          "refId": "A",
          "useBackend": false
        }
      ],
      "title": "IRIS iRacing Gear",
      "transparent": true,
      "type": "stat"
    },
    {
      "datasource": {
        "type": "prometheus",
        "uid": "fekvb739xgqo0c"
      },
      "fieldConfig": {
        "defaults": {
          "color": {
            "mode": "continuous-YlBl"
          },
          "custom": {
            "axisBorderShow": false,
            "axisCenteredZero": false,
            "axisColorMode": "text",
            "axisLabel": "",
            "axisPlacement": "auto",
            "barAlignment": 0,
            "barWidthFactor": 0.6,
            "drawStyle": "line",
            "fillOpacity": 41,
            "gradientMode": "none",
            "hideFrom": {
              "legend": false,
              "tooltip": false,
              "viz": false
            },
            "insertNulls": false,
            "lineInterpolation": "linear",
            "lineWidth": 7,
            "pointSize": 17,
            "scaleDistribution": {
              "log": 2,
              "type": "log"
            },
            "showPoints": "auto",
            "spanNulls": false,
            "stacking": {
              "group": "A",
              "mode": "none"
            },
            "thresholdsStyle": {
              "mode": "off"
            }
          },
          "mappings": [],
          "thresholds": {
            "mode": "absolute",
            "steps": [
              {
                "color": "green"
              },
              {
                "color": "red",
                "value": 80
              }
            ]
          }
        },
        "overrides": []
      },
      "gridPos": {
        "h": 6,
        "w": 24,
        "x": 0,
        "y": 15
      },
      "id": 2,
      "options": {
        "legend": {
          "calcs": [],
          "displayMode": "list",
          "placement": "bottom",
          "showLegend": true
        },
        "tooltip": {
          "hideZeros": false,
          "mode": "single",
          "sort": "none"
        }
      },
      "pluginVersion": "11.6.1",
      "targets": [
        {
          "adhocFilters": [],
          "datasource": {
            "type": "prometheus",
            "uid": "fekvb739xgqo0c"
          },
          "expr": "avg(iracing_speed{} )",
          "fromExploreMetrics": true,
          "interval": "",
          "refId": "A"
        }
      ],
      "title": "Speed",
      "transparent": true,
      "type": "timeseries"
    }
  ],
  "preload": true,
  "refresh": "auto",
  "schemaVersion": 41,
  "tags": [],
  "templating": {
    "list": []
  },
  "time": {
    "from": "now-5m",
    "to": "now"
  },
  "timepicker": {
    "refresh_intervals": [
      "1s",
      "5s",
      "10s",
      "30s",
      "1m",
      "5m",
      "15m",
      "30m",
      "1h",
      "2h",
      "1d"
    ]
  },
  "timezone": "browser",
  "title": "IRIS iRacing",
  "uid": "bekx20ifgrl6oe",
  "version": 33
}
Demo
The video shows us putting the Dashboard and scraping to work in a quick 3 lap shootout at Darlington Motor Speedway.
🏆 This is considered an InterSystems Best Practice