APM - Finding the expensive parts of your application
A practical guide to using the tools PERFMON and MONLBL.
Introduction
When investigating performance problems, I often use the utilities ^PERFMON and ^%SYS.MONLBL to identify exactly where in the application pieces of code are taking a long time to execute. In this short paper I will describe an approach that first uses ^PERFMON to identify the busiest routines and then uses ^%SYS.MONLBL to analyze those routines in detail to show which lines are the most expensive.
The details of ^PERFMON and ^%SYS.MONLBL are individually described in detail in the Caché documentation, but here I summarize when, why and how you can use them together to find the cause of a performance problem in an application.
Instead of listing the many options you can choose, I will tell you the ones I use nearly every time and how I sort through the output.
Summary of the tools
PERFMON and MONLBL are powerful tools that collect statistics from the core of Caché to help understand what the system is doing. They both work with the .INT routines generated when you compile a class and not the class itself.
MONLBL will tell you the number of times each line in a routine was executed, the number of global references at the line and the time spent at the line. In many cases this will pin point the problem. However it isn’t feasible to use MONLBL to profile a large number of routines at once, so you need to identify the busiest routines first. If you know enough about the code to list the routines to monitor that is good but if you don’t you can use PERFMON to identify the target list.
PERFMON counts the number of accesses to globals and routines and breaks them down in different ways. The most useful in this context is to report on globals by routine and routines by routine so you can see which routine executes the most lines and makes the most global references. While those aren’t necessarily the same as ‘taking the most time’ it is normally a very strong indication.
Both tools take significant resources and should rarely be used on a live system because they will impact performance. Be careful because it is easy to exit from the command line prompt and leave the monitor running in the background.
They can’t both be running at the same time, so you have to stop one before starting the other.
You will probably have to increase the parameter gmheap if it is still at the default value from installation.
When and why you should use this approach
You can use this approach if you are looking for pieces of code that are taking a long time to execute or are doing an excessive number of global reads or writes.
The strongest indication that this approach should be followed is that the general performance of an application is OK but a single operation, such as a particular screen or command line operation is consistently taking several seconds or more to execute or does tens of thousands of global references.
It can also work well if the problem is a long running batch job, but in this case there are often different phases of execution so you should collect the statistics at a few different places and check the results are consistent,
If the whole application is slow then this approach probably won’t work well. You should probably look for some resource (CPU, disk etc.) that is being overloaded. PERFMON might be part of that investigation but it probably starts with a system monitor and system wide Caché monitoring tools.
If many operations, that are normally OK, slow down from time to time, then the approach described here is probably not going to help either. You probably want to look to see what is doing work at the problem times and the resources it is tying up.
Running PERFMON to identify busy routines
PERFMON can give you a list of the busiest routines either as the routine that executes the most lines or makes the most global references.
|
Routine Name |
RtnLines |
% Lines |
RtnLoads |
RtnFetch |
Line/Load |
|
epr.LabTestItem.1 |
53723.1 |
15.4 |
3324.4 |
0 |
16.2 |
|
web.EPVisitNumber.1 |
45174.1 |
13 |
268.5 |
0 |
168.2 |
|
epr.LabGraphTestSets.1 |
37587.6 |
10.8 |
7922.2 |
0 |
4.7 |
|
web.MRAdm.1 |
29779.7 |
8.5 |
1719.6 |
0 |
17.3 |
|
lab.EPVisitTestSetData.1 |
22937.9 |
6.6 |
280.2 |
0 |
81.9 |
|
epr.LabTestSet.1 |
21528.6 |
6.2 |
2919.1 |
0 |
7.4 |
|
%Library.Persistent.1 |
20930.4 |
6 |
1420.7 |
0 |
14.7 |
|
%Library.RelationshipObject.1 |
16146.9 |
4.6 |
1417.9 |
0 |
11.4 |
|
……... |
Table 1: Example of PERFMON Routine by Routine output - %Lines is the most helpful column
You first need a system where you can easily reproduce the slow operation. If the operation only takes a few seconds, then you probably need to be able to run it repeatedly in quick succession.
You want the system to be otherwise fairly quiet or it will be difficult to recognize the information in all the other activity. If you can’t get an otherwise quiet system then it may still be possible to use this approach, but you will have to use your judgement about which routines are relevant and it might be hard to separate the signal from the noise.
The sequence will then be
- Get ready to run the slow or expensive operation
- Start PERFMON
- Run the slow operation as often as necessary
- Pause PERFMON
- Generate reports
- Stop PERFMON
To start PERFMON, switch to %SYS namespace and execute the command
DO ^PERFMON
This will give you a numeric menu. Select 1 to start the monitor.
You will be prompted for a number of values and the defaults will probably be OK. The more processes, routines etc. you want to capture data for, the more memory the process will use.
Repeatedly run the slow operation as often as you feel necessary to get a good sample.
Select 3 to pause the monitor and prevent other activity confusing the numbers. Do not stop the monitor as that will get rid of all the statistics that have been collected.
Select 7 to report on the statistics. You are asked for a category, a sort order a format and a filename.
To begin with, I always collect
- Category Globals sorted by Routine
- Category Routine sorted by Routine
- Category Global sorted by Global
I always choose “X=Excel XML” for the format because it is easy to manipulate the reports with Excel.
If you open the output in Excel, it is easy to sort to identify a list of busy routines. Ideally you will get a list of about 10 routines that cover most of the usage. There is little point in including %Library routines at first, but seeing routines like %Library.RelationShipObject.1 near the top can give you a clue about what is going on.
Using MONLBL to profile busy routines
MONLBL reports on the resources used by each line in a routine. It can report on a large number of metrics that might help is special situations, but normally the statistics that are most important are the time taken and the number of globals referenced.
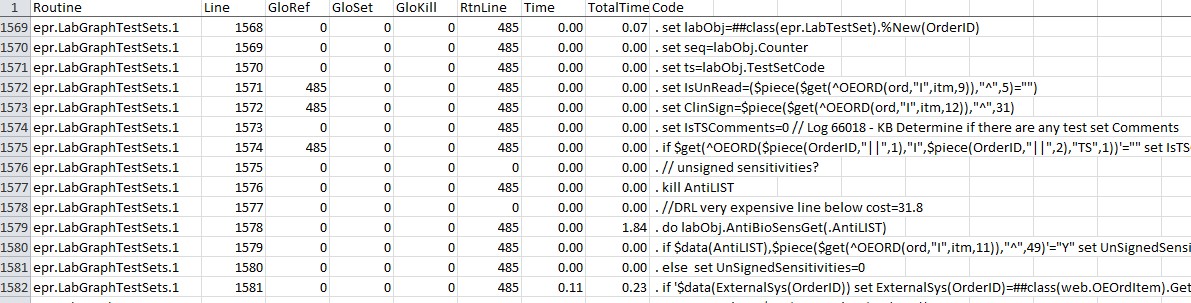
Table 2: Example of MONLBL output
The output will show the source code of the .INT routines if it is available. If the application is in deployed mode or the INT code has not been kept you can still analyze the activity and identify the busiest line numbers but it is much, much harder to make any sense of it.
Once again, get to the point in the application you want to measure before starting the monitor and pause it again as soon as you have captured the data.
The process for capturing and reporting the data is similar to PERFMON. To run MONLBL, switch to the namespace where the application is running and enter the command
Do ^%SYS.MONLBL
It will take you through a number of menu options to start the monitor. It will ask you to specify the routines to monitor. You should provide the names of the busiest .INT routines you got from the PERFMON run. You can use wildcards to make it easier, but don’t make the wildcards too broad or the size of the reports will be hard to manage.
If you capture ‘all metrics’ it is easy enough to filter out the unwanted information from the spreadsheet later. Alternatively if you are doing the repeatedly, you can select ‘Customize Monitor Metrics’ and enter the numbers you want on separate lines. My favorites are 1, 2, 3, 34, 51 and 52 to only generate those columns. If I am only interested in time and not global references 34, 51 and 52 will do.
I then use the option to generate a report in ‘delimited (CSV) format’ so I can open it in Excel. The file generated can by huge and I have included some tips below to make it easier to find the information you need.
For a web interface you don’t normally know which process will be doing the work, so you have to ‘monitor all processes’. If you are submitting a batch job or executing a long running command from the command line then specifying the process ID can greatly cut down on ‘noise’.
Understanding MONLBL output
Even if you narrow the search down to less than ten routines, the MONLBL output can be tens of thousands of lines (most of which are nothing but zeroes) and I always follow the same steps to navigate it. If I haven’t customized the metrics to collect, the first step in Excel is to hide or delete most of the columns. Only keep the first 6 with the line number and the global references; ‘RtnLine’ (around column 36) that says how often the line was executed, the extreme right hand columns ‘Time’, ‘TotalTime’ and the code itself. I then format the cells of the Time columns to only show 2 decimal places. This gets everything I want to see visible without scrolling sideways.
GloRef, GloSet and GloKill show the total number of those operations done at that line. RtnLine is the number of times that line was executed. Time is the aggregate elapsed time in seconds spent executing that particular line excluding any subroutines or system calls. TotalTime is the time spent executing that line including subroutines. TotalTime is always greater than or equal to Time.
At the end of each routine there is a ‘Totals’ line of the form

It is worth skipping through the output looking for all of the 'Totals' line to make sure you have captured meaningful data before going any further.
You probably want to find the lines with the biggest GloRef, Time and TotalTime values. Searching through thousands of lines for interesting values is tedious and difficult. I nearly always use Excel to sort on each of those in turn and write down the largest values. Then after undoing the sort, I can search for those values.
If the Time and TotalTime are equal you may have located the expensive line of code, but you have to make sure it is sensible. If you refreshed a screen five times and it took two seconds per time, you’re looking for somewhere near ten seconds. If the largest values you can find add up to something much smaller, then you have haven’t captured the right information and you may have to rethink what you are doing.
Very often the Total time is much larger than Time, as in the example in Table 3. This was a real performance case I looked at earlier this year. Again you have to check that TotalTime is a big enough value to account for the slow performance and in the example 28.98 seconds was almost exactly what I was looking for and the 3,000 calls to the class method
set TestItemList=##class(web.MRAdm).GetTestList(…)
appear to be causing the problem. If you aren’t monitoring the next routine in the chain, you can run MONLBL again and add it to the list of routines. In this case I was already monitoring that routine and I can see another expensive subroutine call.
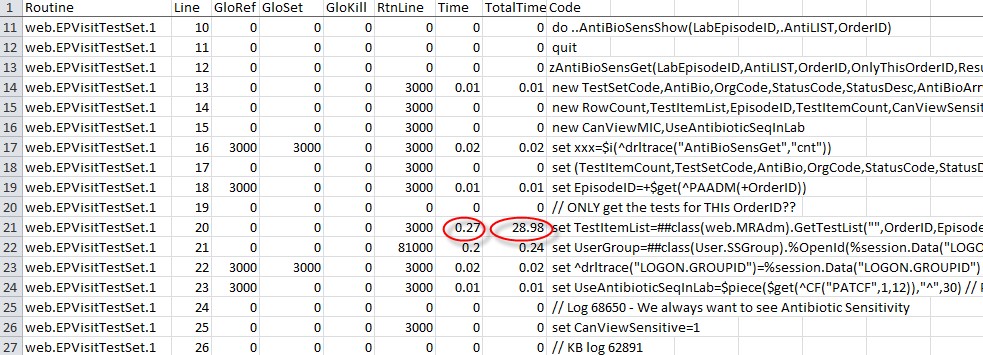
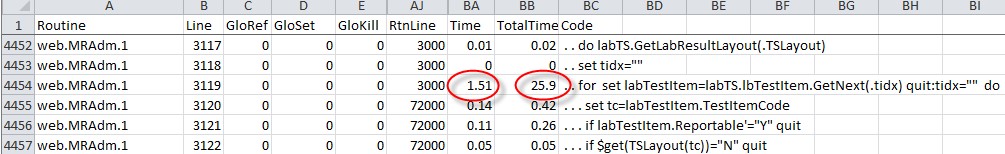
Table 3: Real example highlighting expensive sub routine
Hopefully you eventually get to a point where you can identify a piece of code that is sufficiently localized so you can either improve the expensive code, or reduce the number of times it is called.
Knowing which code is taking the time doesn’t always mean it is easy to rewrite or redesign that part of the application but at least you know what needs to be done.
Comments
Please reupload the images, they are unavailable.
Same problem for me
I see the images so i don't know what the problem is. I will investigate and fix as soon as i can
This pictures hosted somewhere on internal InterSystems server (confluence.iscinternal.com), and you can see while you have access to this server, but we don't have.
fixed.
David, thank you for sharing your experience.
Both tools take significant resources and should rarely be used on a live system
According to my rough estimate, PERFMON provides about of 20% performance penalty when collecting the default metrics. But sometimes we need to evaluate the live system's busiest processes activity in details, e.g. get process stack, process variables, current state, GREF/s, etc.
%SYS.ProcessQuery class methods are evident way to go, while there are some documented notices about possible performance impact.
The question is: which per process metrics can be collected on a live system without significant performance penalty and what is the right way to collect them?