Article
· Dec 22, 2016 2m read
The Polymetric Dashboard

> Customizable System Monitoring. ## Introduction The Polymetric Dashboard is a stand-alone module that provides enhanced monitoring tools for a Caché environment. Equipped with over one hundred sensors that monitor key system metrics, a robust REST API, and a modular AngularJS user interface, the Polymetric Dashboard is fully functional out of the box. However, the Polymetric Dashboard is designed to be customizable; any system metric can be monitored by creating a new sensor, and the visualization of collected data can be tailored to specific requirements and purposes.

9 20
1 1.5K

Hi community,

The aim of this article is to explain how to create messaging between IRIS and Microsoft Teams.

In my company, we wanted to monitor error messages, and we used the Ens.Alert class to redirect those error messages through a Business Operation that sent an email.
The problem was that we sent those error messages to a support account where there were many emails. We wanted something specific for a specific team.

So we investigated how to make these messages reach the development team directly and they could have, in real time, a notification of an error in our production.
In our company we use Microsoft Teams as a corporate tool, so we asked ourselves: How could we make these messages reach the IRIS development team?

29 14
6 467
Article
· Feb 13, 2017 14m read
Creating custom SNMP OIDs

This post is dedicated to the task of monitoring a Caché instance using SNMP. Some users of Caché are probably doing it already in some way or another. Monitoring via SNMP has been supported by the standard Caché package for a long time now, but not all the necessary parameters are available “out of the box”. For example, it would be nice to monitor the number of CSP sessions, get detailed information about the use of the license, particular KPI’s of the system being used and such. After reading this article, you will know how to add your parameters to Caché monitoring using SNMP.

11 14
2 11K

I need to develop a tool to help to get what data is being consumed by a certain process, in order to get all data used to build an automated test scenario.

For example, some user process will pull data from ^GLOBAL(1)="dataString", ^GLOBAL(2)="dataString2", ^GLOBAL1(1)="data1String", ^GLOBAL2(4)="data2String4". Amidst all other data on these Globals, I will ignore everything that was not used in the user process, and get the specific keys used on it.

1 12
0 378
Question
· Jul 16, 2019
Interface Monitoring

Hi all,

I'm looking to set up monitoring for several interfaces. I understand that I can set an Inactivity Timeout. However, obviously there are messages coming through more frequently during certain hours than other hours.

Is there a way to set an Inactivity Timeout for each hour of the day instead of one value that is used all day long?

Best,

Erin

0 12
3 701

Whenever the Windows SNMP Service restarts, the snmpdbg log says the following.

13:08:59 :Attempting initial TCP connection(s) with 1 Cache instances ...
13:08:59 :Get connection with ENSEMBLE on port 1972
13:08:59 :Connection refused on port 1972, check if Cache instance ENSEMBLE is started.
13:08:59 :Cache iscsnmp.dll initialized for 1 configs

Ensemble and all productions are running. I've set up Caché SNMP agent on many other servers in our company and those are working fine. However this one server won't budge.

0 10
0 1.1K

The following steps show you how to display a sample list of metrics available from the /api/monitor service.

In the last post, I gave an overview of the service that exposes IRIS metrics in Prometheus format. The post shows how to set up and run IRIS preview release 2019.4 in a container and then list the metrics.


This post assumes you have Docker installed. If not, go and do that now for your platform :)

17 10
5 1.2K
Article
· Jan 15, 2016 1m read
Activity Monitor in Ensemble 2016.1

Has anyone tried the new Activity Volume Statistics and Monitoring in Ensembel 2016.1? I would love to get some feedback.

If you haven't read about this, there is a dashboard that provides counts and response times for messages sent and received by each configuration item. Alternatively the underlying data is arranged in tables that should make it easy for you to use your favorite SQL reporting tools to generate reports for short term performance monitoring or longer term capacity planning.

Dave

0 9
2 987

One of the topics that comes up often when managing Ensemble productions is disk space:

The database (the CACHE.DAT file) grows in a rate that was unexpected; or the Journal files build up at a fast pace; or the database grows continuously though the system has a scheduled purge of the Ensemble runtime data.

It would have been better if these kind of phenomena would have been observed and accounted for yet at the development and testing stage rather than on a live system.

For this purpose I created a basic framework that could aid in this task.

4 7
2 1.3K
Question
· Aug 13, 2019
Dashboard - Line Graph

Hello,

I want to create a dashboard with a line graph that shows system availability over time. I used this code to create a Dashboard:

            Set tItem = ##class(%DeepSee.UserLibrary.Link).%New()
                Set tItem.fullName = "Availability"
                Set tPage = "Availability.UI.CSVImport.zen"
                Set tItem.href = $system.CSP.GetPortalApp($namespace,tPage)_tPage
                Set tItem.title = "Availability"
                Set tSC = tItem.%Save()
0 7
0 290

As per the documentation of QueueCountAlert:
Number of messages on this item's queue needed to trigger an Alert message to be sent. Note that no further alerts will be sent unless the number of messages on the queue drops below 80% of this number and then rises again to this number.
Note that this alert will be sent even if AlertOnError is False.
Zero means no alerts of this type will be sent.

Now, the question is,
If QueueCountAlert is set to 10, and the queue size become 11 we will be getting email once.

0 6
0 447

Hi all,

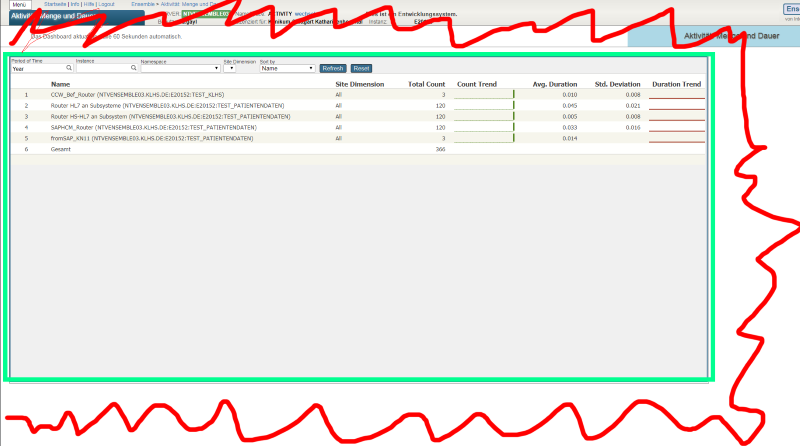
I recently discovered the Monitoring Activity Volume feature in IRIS and I was amazed by it. So, I put it to work in one of our productions. It is nice how easy it is to set up and all the possibilites that came with it.

But there's something weird: the numbers. Actually, one of the BP is stating a time of more than 6 seconds to process:

2 6
1 330

We are constantly running into issues where there are billions of Orphaned messages in our system that cause problems, and we have to manually run a cleanup to fix performance issues.

In the following article about orphaned messages... https://community.intersystems.com/post/ensemble-orphaned-messages it mentions either programmatically eliminating the Orphaned messages or using a Utility like Demo.Util.CleanupSet in ENSDEMO.

0 6
1 620

The MONITOR process (also called the Caché Monitor) scans the messages in your cconsole.log file and sends you emails based on the severity of those messages. The MONITOR is configured using the ^MONMGR utility in terminal.

The MONITOR should not be confused with the similarly named System Monitor, which checks a variety of system health and performance metrics and can log messages regarding them to the cconsole.log, where they can then be scanned by the MONITOR.

2 6
1 1.3K

Can someone direct me to where in the documentation we can find how consumption may be calculated for global storage?

Caché Version2010.1
Operating SystemHP OpenVMS 8.4

EDIT: After receiving some responses, it seems I was unclear in my initial inquiry. I am looking to determine our rate of consumption of storage; however, I am having some difficulty in doing that.

0 6
0 744

Hey Developers,

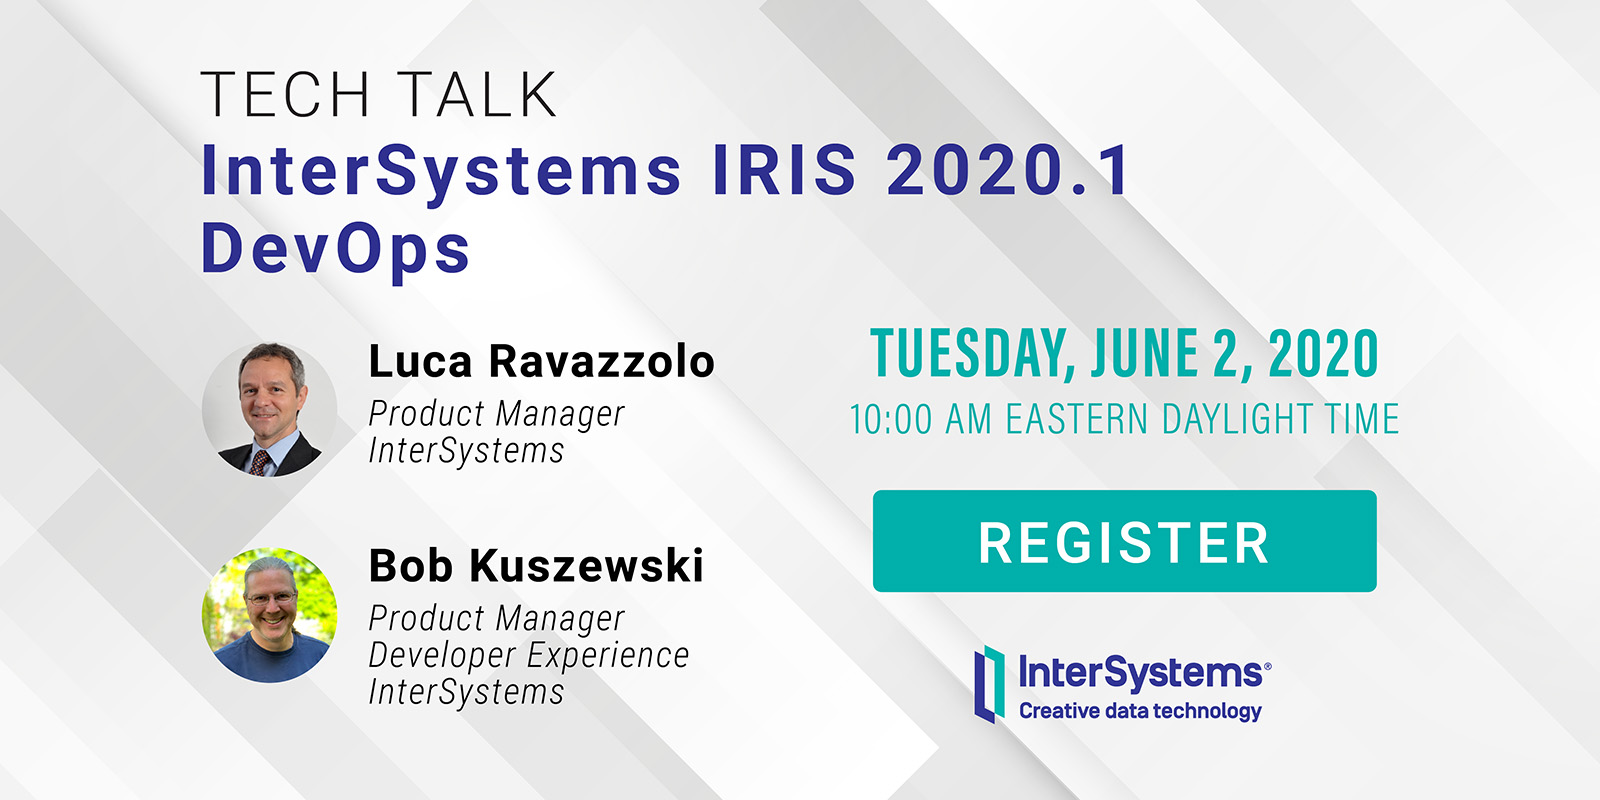
We're pleased to invite you to join the next InterSystems IRIS 2020.1 Tech Talk: DevOps on June 2nd at 10:00 AM EDT!

In this InterSystems IRIS 2020.1 Tech Talk, we focus on DevOps. We'll talk about InterSystems System Alerting and Monitoring, which offers unified cluster monitoring in a single pane for all your InterSystems IRIS instances. It is built on Prometheus and Grafana, two of the most respected open source offerings available.

Next, we'll dive into the InterSystems Kubernetes Operator, a special controller for Kubernetes that streamlines InterSystems IRIS deployments and management. It's the easiest way to deploy an InterSystems IRIS cluster on-prem or in the Cloud, and we'll show how you can configure mirroring, ECP, sharding and compute nodes, and automate it all.

Finally, we'll discuss how to speed test InterSystems IRIS using the open source Ingestion Speed Test. This tool is available on InterSystems Open Exchange for your own testing and benchmarking.

4 6
1 531