Hi Community,
The new video from Global Summit 2019 is already on InterSystems Developers YouTube:
⏯ Understanding System Performance Metrics
Monitoring is a process of controlling and management of performance and availability of software applications.
Hi Community,
The new video from Global Summit 2019 is already on InterSystems Developers YouTube:
⏯ Understanding System Performance Metrics
Hello! This article continues the article "Making Prometheus Monitoring for InterSystems Caché". We will take a look at one way of visualizing the results of the work of the ^mgstat tool. This tool provides the statistics of Caché performance, and specifically the number of calls for globals and routines (local and over ECP), the length of the write daemon’s queue, the number of blocks saved to the disk and read from it, amount of ECP traffic and more. ^mgstat can be launched separately (interactively or by a job), and in parallel with another performance measurement tool, ^pButtons.
Off the back of the Interface Monitoring post I had created a class that queries the Ens.AlertRequest global and returns the entries between 6pm the night before and 6am in the morning.
I tested this build in our T&D environments and the build worked very well.
However in our production environment the query is being truncated, by what I believe to be a timeout and I get a partial query output.
In the System>SQL pages my 12 hour query times out.
I compared the Global size by running a SELECT MAX(ID) query and got a return of 60,244,962 records.
This post is dedicated to the task of monitoring a Caché instance using SNMP. Some users of Caché are probably doing it already in some way or another. Monitoring via SNMP has been supported by the standard Caché package for a long time now, but not all the necessary parameters are available “out of the box”. For example, it would be nice to monitor the number of CSP sessions, get detailed information about the use of the license, particular KPI’s of the system being used and such. After reading this article, you will know how to add your parameters to Caché monitoring using SNMP.
Hi all,
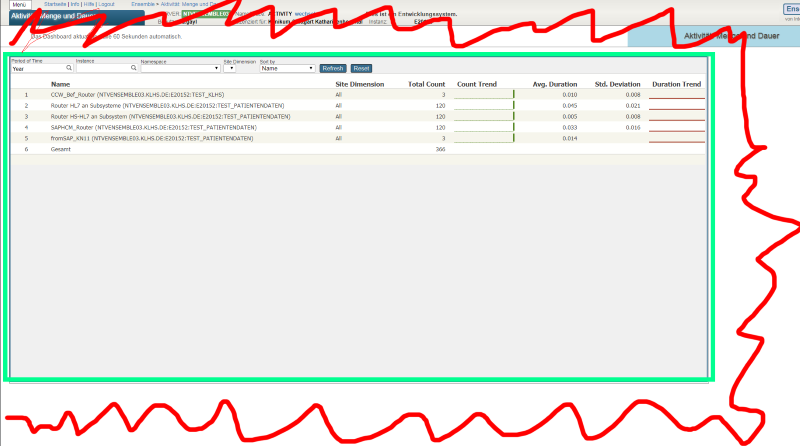
I recently discovered the Monitoring Activity Volume feature in IRIS and I was amazed by it. So, I put it to work in one of our productions. It is nice how easy it is to set up and all the possibilites that came with it.
But there's something weird: the numbers. Actually, one of the BP is stating a time of more than 6 seconds to process:
.png)
But it is not really possible, as our production is running at a pace of about 40 msg/second, being this one the first step. So my question is: how is this avg. duration calculated? What does this time include? Is it in seconds?
Thanks a lot,
Just wanted to share my Zabbix template for monitoring InterSystems IRIS on Linux servers.
It monitors irisusr (configurable) memory consumption:
How to use:
Hello,
I want to create a dashboard with a line graph that shows system availability over time. I used this code to create a Dashboard:
            Set tItem = ##class(%DeepSee.UserLibrary.Link).%New()
                Set tItem.fullName = "Availability"
                Set tPage = "Availability.UI.CSVImport.zen"
                Set tItem.href = $system.CSP.GetPortalApp($namespace,tPage)_tPage
                Set tItem.title = "Availability"
Set tSC = tItem.I'm a DBA and support Caché databases on AIX. I coded shell scripts for monitoring journaling status, databases size, license end date.
We recently got a new instance of Caché on Windows. I'm just curious to know whether anyone coded database monitoring scripts on Windows using PowerShell or any other scripting language.
If yes, please share the details.
Thanks & Regards,
Bharath Nunepalli.
Hi all,
I'm looking to set up monitoring for several interfaces. I understand that I can set an Inactivity Timeout. However, obviously there are messages coming through more frequently during certain hours than other hours.
Is there a way to set an Inactivity Timeout for each hour of the day instead of one value that is used all day long?
Best,
Erin
I've setup ODBC connection so I can access Cache data within SQL Server.
I want to be able to write SQL queries for internal monitoring purposes, similar to what's possible with SQL Server. Specifically I want to be able to check mirroring status (i.e. check which is the current primary mirror member), check the status of any Ensemble productions (started/stopped), check the status of business hosts etc. I want to do all of this from SQL Server to go with our other system monitoring solutions.
Available at:
https://hub.docker.com/r/yape/yape/
$ docker container run --rm -v "$(pwd)":/data yape/yape --version
yape 2.2.6
See the readme at:
https://github.com/murrayo/yape
Changes include:
Has anyone tried the new Activity Volume Statistics and Monitoring in Ensembel 2016.1? I would love to get some feedback.
If you haven't read about this, there is a dashboard that provides counts and response times for messages sent and received by each configuration item. Alternatively the underlying data is arranged in tables that should make it easy for you to use your favorite SQL reporting tools to generate reports for short term performance monitoring or longer term capacity planning.
Dave

Can someone tell me if intersystems-ru/deepsee-sysmon-dashboards is developed for a specific version of Ensemble? Looks like it could be useful to my group but we aren't upgrading till later this year and we are on 2015.2.2.
Thanks
Scott
In looking at the Production monitor within Ensemble, I was wondering if there is a way we could customize it for our use. I notice it is basically a dashboard.
For example I would only like to truly display those Services, Processes, and Operations that are truly in dire need of attention. The Monitor out of the box just seems too busy, and I would like to simplify it.
I was trying to find a sample how a Monitor Dashboard would be setup, but I am not seeing anything in ENSDEMO, or SAMPLES. Has anyone created a Custom Dashboard/Monitor for their purposes?
Hi
I want to get the total amount of time that a process is active or the timestamp that it was created/started.
I tried the %SYS.ProcessQuery class, but I did not find any related information.
Is there any way to get this information from a process?
I'm using Caché 2017.
Hi,
We want to monitor an Ensemble Production and send custom email alerts in function of some Rules. For example, if we normally receive 1 message per second, if suddenly we receive 5 or more messages per second, we want to send an email alert. And if tomorrow we don't want to check this again, we want to disable it through Ensemble Business Rules.
Hi All
I'm looking for the a simple-quick-easy solution to monitor a SQL table thought Ensemble.
I have a process that update a DataBase ,a scheduled task that runs every night (Not Ensemble)
In the end it updates a table (replica_status) with a new recored with two fileds: Id, DateTime
I looked around the community but didn't find an answerd case.
I'm thinking on a Task that will run a sql outboud adapter BO that checks that table and send a alert if no new record was created yesterday
is this the right approach or is there's a better solution?
Thanks Gadi
Has anyone done any kind of integration with Dynatrace, which is a JVM transaction monitoring tool? Our organization uses this extensively with our Java and .Net applications and we wanted to know if it is even possible.
Hi
The message is received at all times.
cconsole.log
(12660) 0 Failed to mount c:\intersystems\ensemble\mgr\ensemble\ because its default collation (20) is not available...(repeated 60 times)
What it this?
Help-me
Tks
Hi community,
I need to monitor Caché Intersystems with some custom indicators.
I started customizing the SNMP Mib. But I've been in a Zabbix event, all speakers use ODBC to monitor their database, Oracle, MySQL, PostgreSQL ...
What is the best way? Use ODBC or SNMP Custom Mib?
What are you guys using?
I want to understand how this message is build:
[SYSTEM MONITOR] CPUusage Alert: CPUusage = 99, 99, 99 (Max value is 85).
Caché keep a log of cpu usage (99,99,99) and how is the frequency of check of this?
how can i chance the max value? is that possible?
Best,
When investigating performance problems, I often use the utilities ^PERFMON and ^%SYS.MONLBL to identify exactly where in the application pieces of code are taking a long time to execute. In this short paper I will describe an approach that first uses ^PERFMON to identify the busiest routines and then uses ^%SYS.MONLBL to analyze those routines in detail to show which lines are the most expensive.
The details of ^PERFMON and ^%SYS.
In short, I wanted to react on CPUusage warnings and alerts with my own actions. It seemed that it was possible in my Caché version (2015.1):
http://docs.intersystems.com/cache201513/csp/docbook/DocBook.UI.Page.cl…
But all my attempts silently failed. Callback code was as simple as possible:
Class %z.Monitor.Health Extends SYS.Monitor.Health.AbstractCallback
{
/// This method is called for every Health Monitor sensor reading.<br>
///.
Application Performance Monitoring
Back in August in preparation for Global Summit I published a brief explanation of Application Performance Management (APM). To follow up on that I have written and will be publishing over the coming weeks a series of articles on APM.
One major element of APM is the construction of a historic record of application activity, performance and resource usage. Crucially for APM the measurement starts with the application and what users are doing with the application.
Using the CSP Page Statistics
Application Performance Management
A key part of Application Performance Management (APM) is recording the activity and performance of user activity. For many web applications the closest you can get to this is to record the CSP pages or CSP based services being dispatched.
If the pages or service names are meaningful and they indicate the business activity being performed the CSP page statistics can be very useful in building up a historical record of activity, performance and resource usage.
I have Ensemble/Healthshare running in a production environment which is setup with a mirror failover and an arbiter sitting between them.
In the event of a failover we have a number of connections that need stopping/monitoring and starting in a certain order.
Is there a programmatic way we can detect the failover and stop certain services and operations immediately and then start them up again in the required order, checking their connection state before starting the next connection.
I am thinking Ens.Director is probably what I need however I need some guidance on how to implement a solution.
Hello,
I would like to implement the Activity Monitor in a Sharepoint page.
How is it possible to integrate only the Zen element?
Is it necessary to develop a CSP application in which this element exists?

Has anyone done this before and can I get a tip?
With kind regards
Armin
Caché Version String: Cache for UNIX (Red Hat Enterprise Linux for x86-64) 2016.2.1
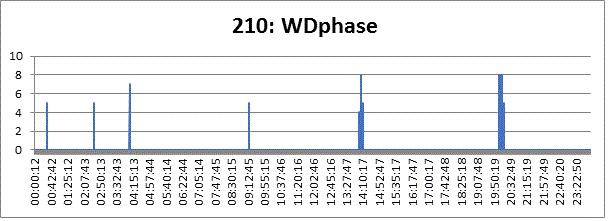
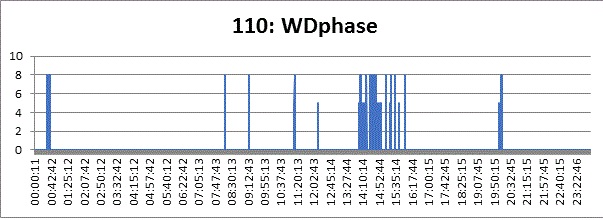
We have a mirrored Ensemble system (110, backup and 210, primary). At one time (14:00) there is a disruption in the production. The messages are not being processed.
Looking at the pButtons (every 10 seconds) I see the following abnormal at the WDphase

and the backup

The different values of WDphase are:
0: Idle (WD is not running)
5: WD is updating the Write Image Journal (WIJ) file.
7: WD is committing WIJ and Journal.
8: Databases are being updated.
Is it possible to dynamically adjust the RetryInterval andFailureTimeout settings in a BPL?
I've got a business process that calls a web service operation to get a session ID from an external system. There is a string property returned in the body of the response that indicate an exception occurred in the external system. I have code in the BPL that examines the property and sets the status property to an error status when that occurs.
Depending on what the value is I want to adjust the RetryInterval and FailureTimeout values used in by the system when the ReplyCodeActions is set to E=RD.
Please excuse my ignorance. I am trying to identify what areas would be best to review in the System Dashboard (for Cache 2010.2) for performance issues with the database. It seems to be running slower than usual, but I am trying to find out the best way to go about identifying what the issue is.
The following are captures from the System Dashboard.
As always, thanks a lot for your help.


