Application Performance Monitoring
Tools in InterSystems technology
Back in August in preparation for Global Summit I published a brief explanation of Application Performance Management (APM). To follow up on that I have written and will be publishing over the coming weeks a series of articles on APM.
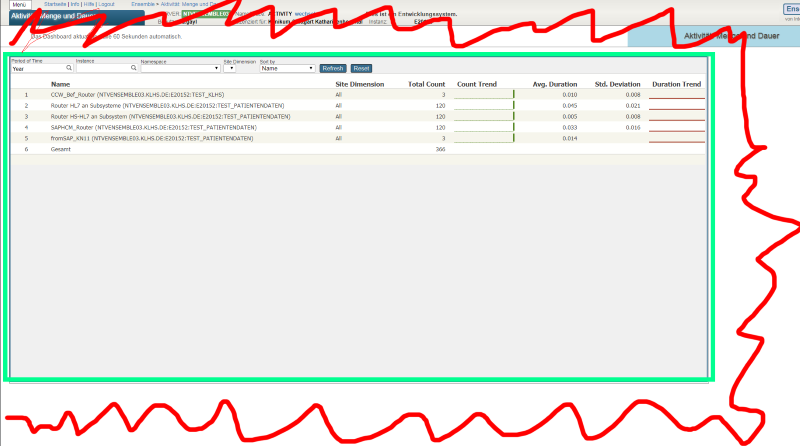
One major element of APM is the construction of a historic record of application activity, performance and resource usage. Crucially for APM the measurement starts with the application and what users are doing with the application.