Activity Monitor in Ensemble 2016.1
Has anyone tried the new Activity Volume Statistics and Monitoring in Ensembel 2016.1? I would love to get some feedback.
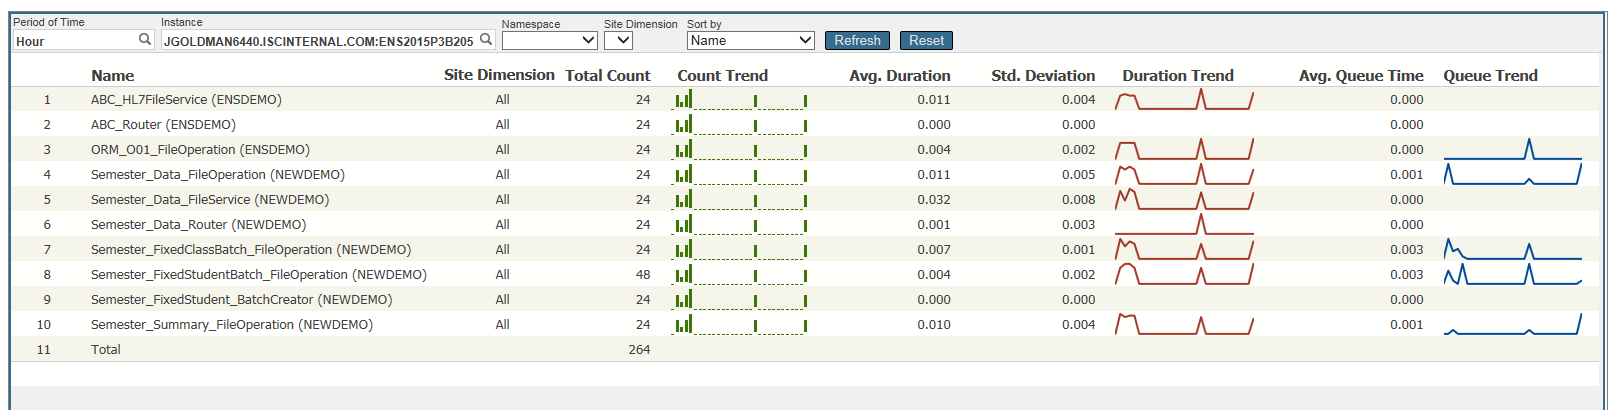
If you haven't read about this, there is a dashboard that provides counts and response times for messages sent and received by each configuration item. Alternatively the underlying data is arranged in tables that should make it easy for you to use your favorite SQL reporting tools to generate reports for short term performance monitoring or longer term capacity planning.
Dave
Comments
Hi Dave,
I have started playing around with Activity Volume Statistics and Monitoring and I think the capability is great. This could potentially remove a lot of custom stat capturing involved with my project.
I do have a couple questions though. I'm a little confused on how these three class methods should be used from the Ens.Util.Statistics class (the documentation reads very similar for all three):
- StatsStarted()
- StatsActive()
- InitStats()
I have enabled stats gathering for specific business hosts in a namespace and I can see that the ReportItemsEnabledForStats() class method returns an array indicating the hosts are enabled. However, all of the above class methods return a value of 0.
I have read through the custom code documentation on this and I'm wondering how the conditional example (using the StatsStarted() method) gets evaluated to True. I am basically trying to add a custom Site Dimension, but can only get one to show in the dashboard if I remove the conditional in the example.
Hi James
i don't know exactly what you are doing so i'll give some background and you can ask more questions.
InitStats initializes the local counters. Like resetting and starting the stopwatch.
RecordStats takes the values since InitStats and adds them to the temporary array.
The framework call these two for you. For example Ens.BusinessService.ProcessInput() of a business service calls them to capture the activity of a single invocation of a business service.
If you want to capture stats in your own code you can call them yourself.
If you have called SetStatsUserDimension between the two then that value is put in the userdimension field. For example, if my application has a business service that is accepting orders for widgets then in OnProcessInput I might have the line
do ##class(Ens.Util.Statistics).SetStatsUserDimension(..%ConfigName,pInput.Color)
and I would be able to get a breakdown of statistics for black, blue or green widgets
If you want to use your own statistics instead of out elapsed time and count, you can use RecordStats to write whatever values you like to the temporary array.
StatsStarted() is supposed to be used to check that statistics gathering has been turned on for the production or config item. For now, just don’t use it and assume the stats are turned on. I will find out more.
I don’t remember what StatsActive() means you probably don’t need to call it. I have never used it.
Dave
Thanks for the quick response, Dave.
I'm basically messing around with collecting custom stats. I was trying to use the example in the "Writing Custom Code to Record Activity" section in my own code, but it seemed like StatsStarted() wasn't returning what I expected(essentially saying that stats collection has never been started). It was conflicting with what ReportItemsEnabledForStats() was showing.
I'll play around with this some more with your suggestions. Thanks again!
I looked at the code and StatsStarted returns 1 if InitStats has been called within the current business service. So it is more than statistics being enabled for that config item.
I will get someone to look at the sample code.
Is this framework intended to be running constantly to gather stats on a Production-level environment? (i.e. does this framework come with a large overhead?)
Or is its intended use more for planned testing where stats are enabled/disabled during some interval?
it is intended for constant collection of statistics from a live system.
To minimize the overhead, the counts are accumulated in memory and written to disk at intervals. Benchmarks showed no significant increase in resources consumed with statistic gathering turned on.
This means the package avoids anything that would be relatively expensive to collect. For example several people have asked for the average size of a message to be collected but this would have needed an extra method call to get the information.
It also means that the statistics are not guaranteed to be correct if the system crashes.
Hi,
just starting to look at it. From a UI perspective - if you do not select an Instance, or Namespace filter in the display, the Name column fully qualifies the component by adding Instance:Namespace - which is great. This make the column wider, pushing "Avg Que Time" and "Queue Trend" columns outside of the display are and invisible.
There is no horizontal scroll bar to bring them back in.
Steve
Here's another question about the Activity Monitor with respect to having so much activity the page takes a few minutes to render.
I checked the documentation but didn't really find a way to define something like a "SiteDimension" that would perhaps list messages consumed by services (or maybe a specific category?), or messages sent by all operations in the running production in the hopes that something like that might run faster when viewing?
Please keep in mind this isn't a site that has a DeepSee license, so creating cubes, etc., doesn't seem to be something that can be done with this system.
Would a better approach be to expose the data collected via some sort of RESTful service and have something like Grafana or similar do an external dashboard? I've seen some interesting writeup's on this subject so trying to determine if staying with the built-in Activity Monitor is a viable option for a high-volume site.
Thanks!
The page in the management portal is limited and was never intended to meet the needs of everyone.
The intention was to make the information readily accessible from SQL, so people could use their favorite reporting tool or dashboard product.
Wrapping SQL in a restful service would be straightforward and there is an example of a REST service that calls a query and generates the JSON for Grafana here
Dave