Creating custom SNMP OIDs
This post is dedicated to the task of monitoring a Caché instance using SNMP. Some users of Caché are probably doing it already in some way or another. Monitoring via SNMP has been supported by the standard Caché package for a long time now, but not all the necessary parameters are available “out of the box”. For example, it would be nice to monitor the number of CSP sessions, get detailed information about the use of the license, particular KPI’s of the system being used and such. After reading this article, you will know how to add your parameters to Caché monitoring using SNMP.
What we already have
Caché can be monitored using SNMP. A full list of what’s supported can be found in the files of the <Install_dir>/SNMP/. You should find 2 files there: ISC-CACHE.mib and ISC-ENSEMBLE.mib. We are interested in the file intended for Caché — ISC-CACHE.mib. In particular, we’d like to know what information we can get about licenses and sessions. The table contains corresponding OID’s provided that the hierarchy starts from the root for InterSystems— 1.3.6.1.4.1.16563
| OID | Name | Description | Data type |
|---|---|---|---|
| .1.1.1.1.10 | cacheSysLicenseUsed | The current number of licenses used on this Caché instance | INTEGER |
| .1.1.1.1.11 | cacheSysLicenseHigh | The high-water mark for licenses used on this Caché instance | INTEGER |
| .1.2.16 | cacheLicenseExceed | A request for a license has exceeded the licenses available or allowed | Trap message |
| .1.1.1.1.6 | cacheSysCurUser | Current number of users on this Caché instance | INTEGER |
The package lacks many important parameters, such as, for instance, the number of CSP sessions, license information and, of course, does not have application-specific KPI’s.
Here is an example of what we’d like to know:
- The number of CSP users;
- Limitations of our license in terms of the user count;
- License expiry date.
Let’s also add a few parameters for performance analysis. The parameters themselves are in the package, but we want to know the increment per minute, for example:
- The increase of the number of “global” references per minute;
- The number of executed command per minute;
- The number of routine calls per minute.
How to add “your” parameters
You can rely on the “Monitoring Caché using SNMP” document.
The Caché version of our test instance (CACHE2016) is 2016.2.0.721.0. The operating system is Linux Fedora 24 (Workstation Edition). Caché installation on Linux OS is described in detail on here.
Here is our agenda:
- Create a class for collecting metrics;
- Register and activate a new class in Caché using ^%SYSMONMGR;
- Create a user MIB using MonitorTools.SNMP class methods. We’ll use 99990 as a temporary PEN (Private Enterprise Number), but will need to register with IANA afterwards. This procedure is free, takes a week or two and requires some email exchange along the lines of “what do you need your own PEN for?”;
- Start a monitoring service with a connected Caché subagent;
- Use snmpwalk to make sure we have access to all our newly-created OID’s;
- Add our OID’s to to a third-party monitoring system. Let’s use Zabbix, for example. Zabbix documentation is available here. Let’s make sure that monitoring is up and running;
- Add the start of the system monitor in our TEST namespace to the system startup list.
Let’s now follow the agenda, point by point:
1. Create a class for collecting metrics
The metrics collection class extends %Monitor.Adaptor. In the Terminal we switch to the %SYS namespace and export the hidden Monitor.Sample class:
%SYS>do $system.OBJ.Export("Monitor.Sample.cls","/tmp/Monitor_Sample.xml")
Exporting to XML started on 02/07/2017 21:39:56
Exporting class: Monitor.Sample
Export finished successfully.
Let’s assume that the TEST namespace is our working area. Let’s switch to it and import the Monitor.Sample class here. Now, we create a class that describes the implementation of a monitoring mechanism for the 6 metrics described in the “What we already have” section.
Class monitoring.snmp.Metrics Extends %Monitor.Adaptor
{
/// Give the application a name. This allows you to group different
/// classes together under the same application level in the SNMP MIB.
/// The default is the same as the Package name.
Parameter APPLICATION = "Monitoring";
/// CSP sessions count
Property Sessions As %Monitor.Integer;
/// License user limit
Property KeyLicenseUnits As %Monitor.Integer;
/// License key expiration date
Property KeyExpirationDate As %Monitor.String;
/// Global references speed
Property GloRefSpeed As %Monitor.Integer;
/// Number of commands executed
Property ExecutedSpeed As %Monitor.Integer;
/// Number of routine loads/save
Property RoutineLoadSpeed As %Monitor.Integer;
/// The method is REQUIRED. It is where the Application Monitor
/// calls to collect data samples, which then get picked up by the
/// ^SNMP server process when requested.
Method GetSample() As %Status
{
set ..Sessions = ..getSessions()
set ..KeyLicenseUnits = ..getKeyLicenseUnits()
set ..KeyExpirationDate = ..getKeyExpirationDate()
set perfList = ..getPerformance()
set ..GloRefSpeed = $listget(perfList,1)
set ..ExecutedSpeed = $listget(perfList,2)
set ..RoutineLoadSpeed = $listget(perfList,3)
quit $$$OK
}
/// Get CSP sessions count
Method getSessions() As %Integer
{
// This method will only work if we don't use WebAddon:
// quit $system.License.CSPUsers()
//
// This will work even if we use WebAddon:
set csp = ""
try {
set cn = $NAMESPACE
znspace "%SYS"
set db = ##class(SYS.Stats.Dashboard).Sample()
set csp = db.CSPSessions
znspace cn
} catch e {
set csp = "0"
}
quit csp
}
/// Get license user's power
Method getKeyLicenseUnits() As %Integer
{
quit $system.License.KeyLicenseUnits()
}
/// Get license expiration date in human-readable format
Method getKeyExpirationDate() As %String
{
quit $zdate($system.License.KeyExpirationDate(),3)
}
/// Get performance metrics (gloref, rourines etc.)
Method getPerformance(param As %String) As %Integer
{
set cn = $NAMESPACE
znspace "%SYS"
set m = ##class(SYS.Monitor.SystemSensors).%New()
do m.GetSensors()
znspace cn
quit $listbuild(m.SensorReading("GlobalRefsPerMin"),
m.SensorReading("RoutineCommandsPerMin"),
m.SensorReading("RoutineLoadsPerMin"))
}
}
Make sure that the GetSample() method really fetches the necessary data for us:
TEST>set metrics = ##class(monitoring.snmp.Metrics).%New()
TEST>write metrics.GetSample()
1
TEST>zwrite metrics
metrics=<OBJECT REFERENCE>[2@monitoring.snmp.Metrics]
+----------------- general information ---------------
| oref value: 2
| class name: monitoring.snmp.Metrics
| reference count: 2
+----------------- attribute values ------------------
| ExecutedSpeed = 431584
| GloRefSpeed = 881
| KeyExpirationDate = "2017-02-28"
| KeyLicenseUnits = 100
| RoutineLoadSpeed = 0
| Sessions = 1
+-----------------------------------------------------
2. Let’s register and activate the new class in Caché using ^%SYSMONMGR
Open the terminal and switch to the TEST namespace:
# csession cache2016 -U test
Node: server, Instance: CACHE2016
TEST>do ^%SYSMONMGR
1. Select item 5, Manage Application Monitor.
2. Select item 2, Manage Monitor Classes.
3. Select item 3, Register Monitor System Classes.
Exporting to XML started on 02/09/2017 11:22:57
Exporting class: Monitor.Sample
Export finished successfully.
Load started on 02/09/2017 11:22:57
Loading file /opt/intersystems/cache2016/mgr/Temp/Mb7nvq5xuovdHQ.stream as xml
Imported class: Monitor.Sample
Compiling class Monitor.Sample
Compiling table Monitor.Sample
Compiling routine Monitor.Sample.1
Load finished successfully.
4. Select item 1, Activate/Deactivate Monitor Class
Class??
Num MetricsClassName Activated
1) %Monitor.System.AuditCount N
…
15) monitoring.snmp.Metrics N
Class? 15 monitoring.snmp.Metrics
Activate class? Yes => Yes
5. Select item 6, Exit
6. Select item 6 again, Exit
7. Select item 1, Start/Stop System Monitor
8. Select item 2, Stop System Monitor
Stopping System Monitor… System Monitor not running!
9. Select item 1, Start System Monitor
Starting System Monitor… System Monitor started
10. Select item 3, Exit
11. Select item 4, View System Monitor State
Component State
System Monitor OK
%SYS.Monitor.AppMonSensor OK
12. Select item 7, Exit
3. Create a user MIB
A user MIB is created with the help of MonitorTools.SNMP class methods. For this example, let’s use a fake PEN (Private Enterprise Number), 99990, but the PEN will have to be registered with IANA afterwards. You can view registered numbers here. For example, InterSystems’ PEN is 16563.
16563
InterSystems
Robert Davis
rdavis&intersystems.com
We will use the MonitorTools.SNMP class and its CreateMIB() method to create a MIB file. This method takes 10 arguments:
| Argument name and type | Description | Value |
|---|---|---|
| AppName As %String | application name | Value of the APPLICATION parameter of the metrics.snmp.Metrics class— Monitoring |
| Namespace As %String | our namespace | TEST |
| EntID As %Integer | company PEN |
99990 (fiction) |
| AppID As %Integer | application OID inside the company | 42 |
| Company As %String | company name (capital letters) | fiction |
| Prefix As %String | prefix of all SNMP objects we create | fiction |
| CompanyShort As %String | short company prefix (capital letters) | fict |
| MIBname As %String | name of the MIB file |
ISC-TEST |
| Contact As %String | contact information (address, in particular) | Let’s leave the default value: Earth, Russia, Somewhere in the forests, Subject: ISC-TEST.mib |
| List As %Boolean | equivalent to verbose. Show task progress for the MIB file | 1 |
And here comes the creation of the MIB file:
%SYS>d ##class(MonitorTools.SNMP).CreateMIB("Monitoring","TEST",99990,42,"fiction","fict","fiction","ISC-TEST",,1)
Create SNMP structure for Application - Monitoring
Group - Metrics
ExecutedSpeed = Integer
GloRefSpeed = Integer
KeyExpirationDate = String
KeyLicenseUnits = Integer
RoutineLoadSpeed = Integer
Sessions = Integer
Create MIB file for Monitoring
Generate table Metrics
Add object ExecutedSpeed, Type = Integer
Add object GloRefSpeed, Type = Integer
Add object KeyExpirationDate, Type = String
Add object KeyLicenseUnits, Type = Integer
Add object RoutineLoadSpeed, Type = Integer
Add object Sessions, Type = Integer
MIB done.
There is new MIB ISC-TEST.mib in the <Install_dir>/mgr/TEST folder now.
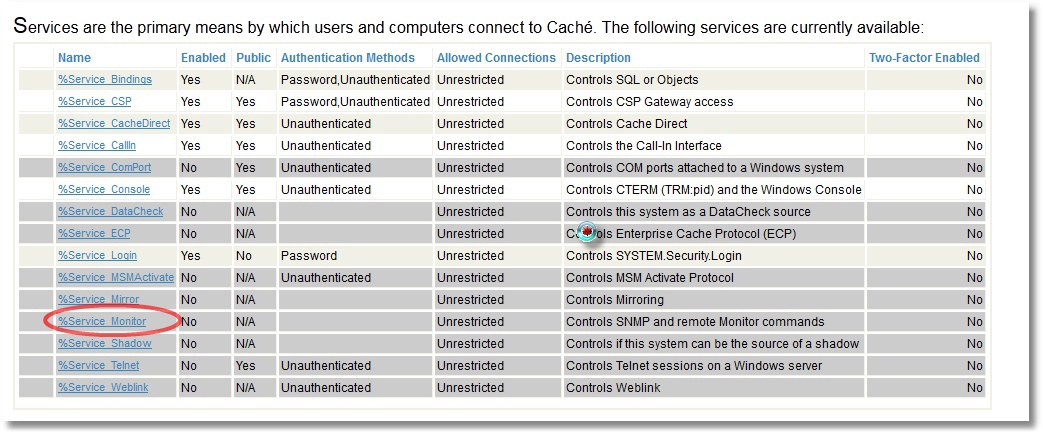
4. Start the monitoring service with the connected Caché subagent
Let’s open the System Administration -> Security -> Services -> %Service_Monitor (click) -> Service Enabled (check).
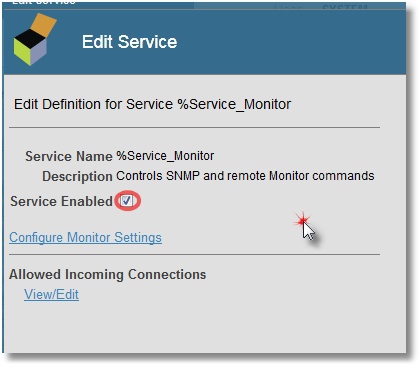
We also specify that we want to start the SNMP subagent when Caché is started (click on Configure Monitor Settings):

In Linux, we use the net-snmp package for SNMP monitoring. So we install it, configure it to be used with subagents and specify port 705 as the default one for the master agent to talk with subagents.
# grep -i agentx /etc/services
agentx 705/tcp # AgentX
agentx 705/udp # AgentX
A small article about the snmpd.conf configuration file that complements the manual can be found on cyberciti. Here is your final set of settings:
# yum install net-snmp
# grep '^[^#]' /etc/snmp/snmpd.conf
master agentx
agentXSocket TCP:localhost:705
com2sec local localhost public
group MyRWGroup v1 local
group MyRWGroup v2c local
group MyRWGroup usm local
view all included .1 80
view system included .iso.org.dod
access MyROGroup "" any noauth exact all none none
access MyRWGroup "" any noauth exact all all none
syslocation server (edit /etc/snmp/snmpd.conf)
syscontact Root <root@localhost> (configure /etc/snmp/snmp.local.conf)
dontLogTCPWrappersConnects yes
Let’s restart the snmpd and snmptrapd daemons in Linux. After that, we start the SNMP service to activate the SNMP Caché subagent:
%SYS>do start^SNMP
%SYS>; Check SNMP subagent status
%SYS>zwrite ^SYS("MONITOR")
^SYS("MONITOR","SNMP")="RUN"
^SYS("MONITOR","SNMP","NAMESPACE")="%SYS"
^SYS("MONITOR","SNMP","PID")=5516
^SYS("MONITOR","SNMP","PORT")=705
^SYS("MONITOR","SNMP","STARTUP")="SNMP agent started on port 705, timeout=20, winflag=0, Debug=0"
^SYS("MONITOR","SNMP","STATE")="Terminated - 01/27/2017 04:15:01.2833PM"
^SYS("MONITOR","SNMP","WINSTART")=0
5. Check that only our own, newly-created user OID’s are available.
This can be done using snmpwalk — we’ll display the OID showing the number of CSP sessions:
# snmpwalk -On -v 2c -c public localhost 1.3.6.1.4.1.99990
# snmpwalk -On -v 2c -c public localhost 1.3.6.1.4.1.99990
.1.3.6.1.4.1.99990.42.1.1.1.1.9.67.65.67.72.69.50.48.49.54 = INTEGER: 559851
.1.3.6.1.4.1.99990.42.1.1.1.2.9.67.65.67.72.69.50.48.49.54 = INTEGER: 973
.1.3.6.1.4.1.99990.42.1.1.1.3.9.67.65.67.72.69.50.48.49.54 = STRING: "2017-02-28"
.1.3.6.1.4.1.99990.42.1.1.1.4.9.67.65.67.72.69.50.48.49.54 = INTEGER: 100
.1.3.6.1.4.1.99990.42.1.1.1.5.9.67.65.67.72.69.50.48.49.54 = INTEGER: 0
.1.3.6.1.4.1.99990.42.1.1.1.6.9.67.65.67.72.69.50.48.49.54 = INTEGER: 2
# If you get such result
# .1.3.6.1.4.1.99990 = No Such Object available on this agent at this OID
# try to restart SNMP subagent in Caché in this way:
# do stop^SNMP
# do start^SNMP
The ISC-TEST.mib file contains the sequence of our OID’s:
FictMetricsR ::=
SEQUENCE {
fictExecutedSpeed Integer32,
fictGloRefSpeed Integer32,
fictKeyExpirationDate DisplayString,
fictKeyLicenseUnits Integer32,
fictRoutineLoadSpeed Integer32,
fictSessions Integer32
}
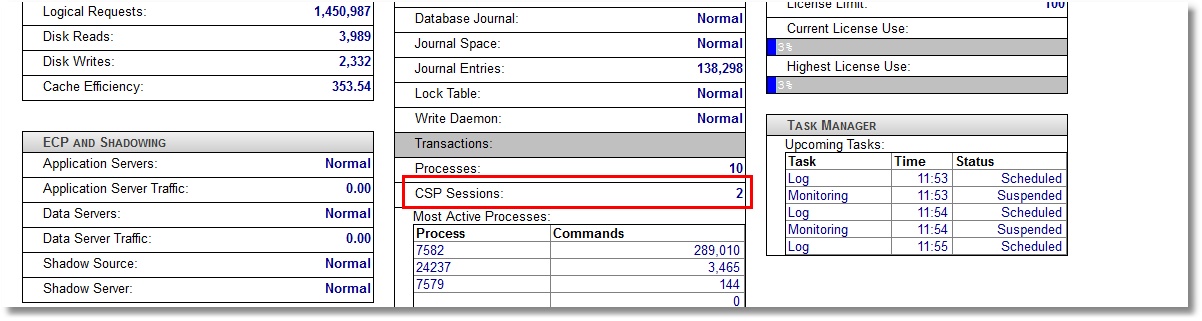
Accordingly, the number of sessions, for example, is the last OID 1.3.6.1.4.1.99990.42.1.1.1.6. You can compare it with the number of sessions shown on the SMP dashboard:
6. Let’s add our OID’s to an external monitoring system.
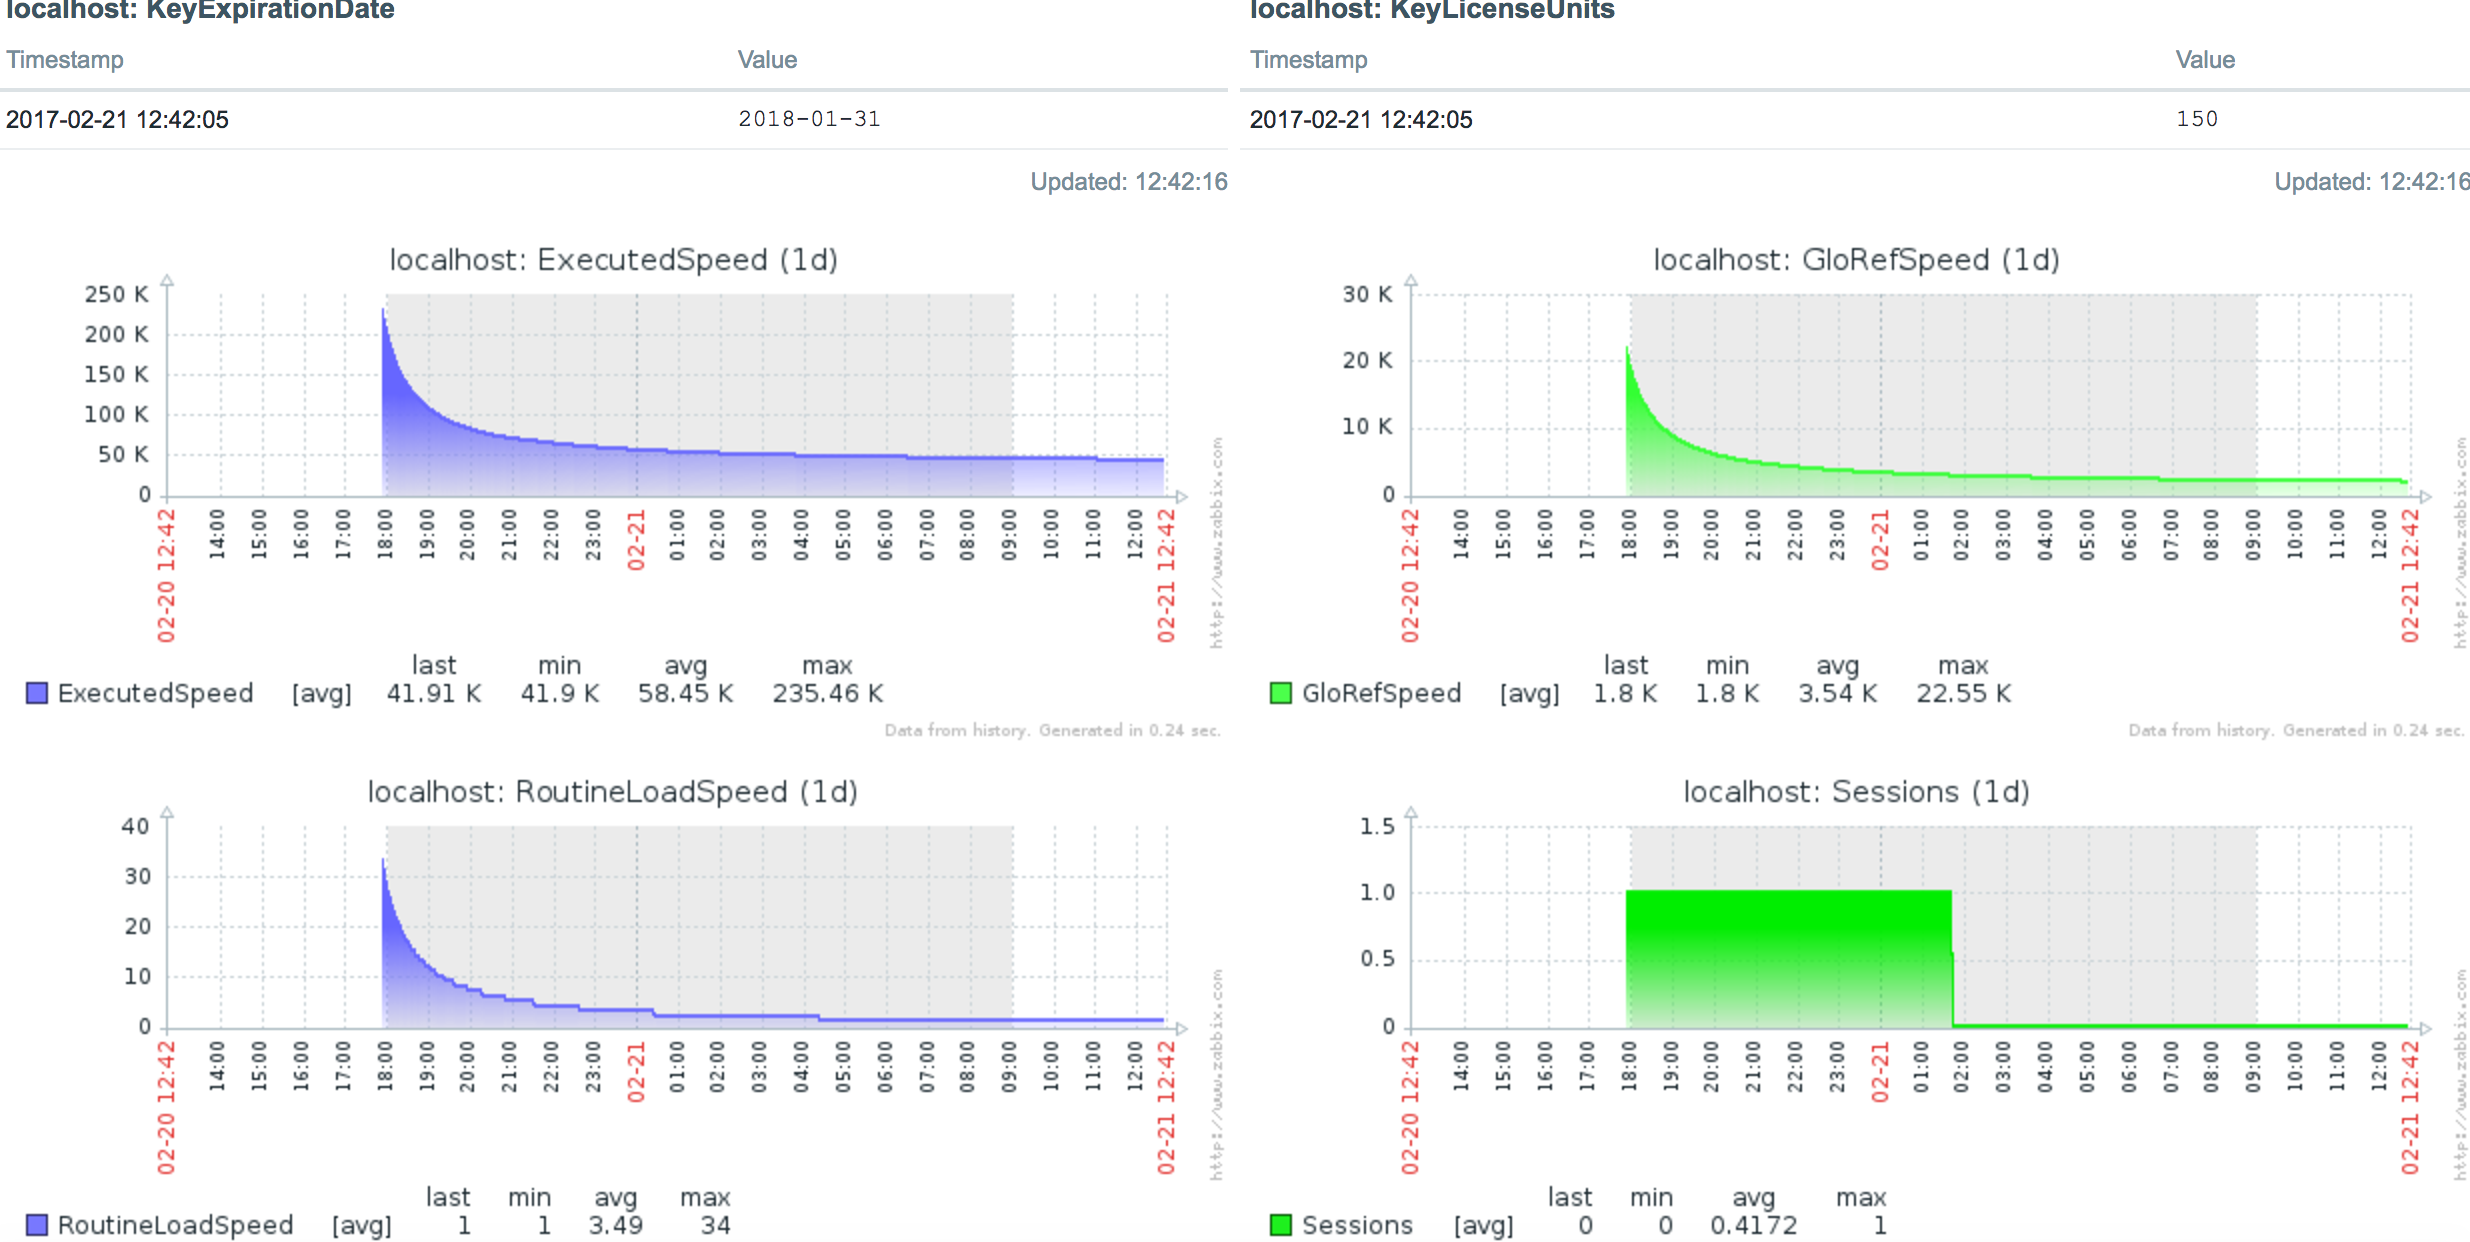
Let’s use Zabbix. Zabbix documentation can be found here. A detailed Linux installation and configuration guide for Zabbix is available here. Zabbix was selected as a system that not only allows you to draw charts, but also monitor Plain Text (in our case, license expiry date and license units). After adding our 6 metrics to our local host items (type: SNMPv2 agent) and creating 4 graphs and 2 PlainText parameters (as screen elements), we should see the following picture:

Above is the information about license expiry and the number of available license slots. Graphs speak for themselves.
7. Let’s add the launch of the system monitor to the startup list of our TEST namespace.
There is a pretty good document about user routines executed when Caché starts and stops. They are called %ZSTART and %ZSTOP, accordingly.
What we are interested in is that the system monitor (^%SYSMONMGR) starts in the TEST namespace during the system start. By default, this monitor only starts on the %SYS namespace. Therefore, we will only look at the ^%ZSTART program. The source is in %ZSTART.mac (create and save it to the %SYS namespace).
%ZSTART; User startup routine.
SYSTEM;
; Cache starting
do $zu(9,"","Starting System Monitor in TEST namespace by ^%ZSTART...Begin")
znspace "TEST"
set sc = ##class(%SYS.Monitor).Start()
do $system.OBJ.DisplayError(sc)
if (sc = 1) {
do $zutil(9,"","Starting System Monitor in TEST namespace by ^%ZSTART...OK")
} else {
do $zutil(9,"","Starting System Monitor in TEST namespace by ^%ZSTART...ERROR")
}
; Starting SNMP
znspace "%SYS"
do start^SNMP
quit
LOGIN;
; a user logs into Cache (user account or telnet)
quit
JOB;
; JOB'd process begins
quit
CALLIN;
; a process enters via CALLIN interface
quit
Another way to do the same is using ^%SYSMONMGR:
%SYS>do ^%SYSMONMGR
1. Select item 3, Configure System Monitor Classes.
2. Select item 2, Configure Startup Namespaces.
3. Select item 2, Add Namespace.
Namespace? TEST
4. Select item 1, List Start Namespaces.
Option? 1
TEST
5. Select item 4, Exit.
6. Select item 3, Exit.
7. Select item 8, Exit.
Let’s now restart Caché (if possible) to make sure that SNMP stats continue to be collected after a restart.
This is it. Perhaps, some will question my choice of monitored parameters or code, but the task was to show the mere possibility of implementing such monitoring in principle. You can add extra parameters or refactor your code later.
Thank you for your attention!
Comments
Hi, Mikhail!
Is there any online demo of this SNMP monitoring available?
Hi, Evgeny! I'll try to organize it soon.
Login: operator
Pass: ZabbixOperator
Then press "Monitoring" -> "Screens"
Nice!
Good day,
Could you please share your Zabbix-ready template?
Good day!
In article a simple example is described. In reality you should use Zabbix Discovery. I'll try to show this process soon. Please, wait for a couple of days.
Hi! Link to template with some of metrics is attached. You can easily add other standard metrics as well as your own. Meaning of the metrics see in <cache_dir>/mgr/SNMP/ISC-CACHE.mib. If you have any questions, fill free to ask them.
https://github.com/myardyas/zabbix/blob/master/zabbix_cache_snmp_exampl…
Trying in 2017.1 field test... it seems there is no SYS.Monitor.SystemSensors class... has it disappeared in 2017.1?
Forget it... it doesn't appear in Class Reference (I don't know why), but it's there.
Class signature is:
Class SYS.Monitor.SystemSensors Extends %SYS.Monitor.AbstractSensor [ Hidden, System = 3 ]
So it's absent either in Class Reference or Studio, but it can be shown in Studio using "Open" command and typing Systems.Sensors.cls in search field. Methods of this class are deployed so you cannot see their implementation.
Hello my dear, my system is solaris10, now reported "03/22/18-18:35:10:310 (12412) 1 SNMP process unable to open TCP port 705"; how do I get on this OS net- Snmpd.conf inside snmp to enable 705 ports?
Hi!
Unfortunately, I didn't have cases with Solaris, so I'll answer in style RTFM -)
An official InterSystems documentation says:
Note:
On Oracle Solaris, the System Management Agent (SMA), although a version of NET-SNMP, is not compatible with the Cache AgentX implementation. You will therefore need to disable the SMA agent (and possibly the older snmpdx agent as well) and install a standard version of NET-SNMP to support AgentX.
You can read more about SNMP support on Solaris here.
Dear Mikhail,
Could you please share these classes? I am using a version of healshare that does not allow me to create them.
Thank you
Fernando Iglesias
 The article is considered as InterSystems Data Platform Best Practice.