Article
· Jan 15, 2016 1m read
Activity Monitor in Ensemble 2016.1

Has anyone tried the new Activity Volume Statistics and Monitoring in Ensembel 2016.1? I would love to get some feedback.

If you haven't read about this, there is a dashboard that provides counts and response times for messages sent and received by each configuration item. Alternatively the underlying data is arranged in tables that should make it easy for you to use your favorite SQL reporting tools to generate reports for short term performance monitoring or longer term capacity planning.

Dave

0 9
2 987
Question
· Feb 26, 2018
Monitoring with Zabbix

Hi community,

I need to monitor Caché Intersystems with some custom indicators.


I started customizing the SNMP Mib. But I've been in a Zabbix event, all speakers use ODBC to monitor their database, Oracle, MySQL, PostgreSQL ...

What is the best way? Use ODBC or SNMP Custom Mib?
What are you guys using?

0 2
0 944
Article
· Jun 9, 2016 1m read
Ensemble monitoring

First post! In order to somewhat redeem myself for an unnecessary call to support, I've decided to post some classes that I've written to monitor certain metrics inside our Ensemble Live instance (yeah, Kyle, you WERE laughing at me, but it's okay). What the classes do is to run queries and code to get database sizes, status of the mirror, counts of rows in tables such as EnsLib.HL7.Message and Ens.MessageHeader. The data is collected and written to tables and then an email is sent out daily upon completion. I've found this quite useful in keeping an eye on what's going on. It's help

5 5
1 894

I want to understand how this message is build:

[SYSTEM MONITOR] CPUusage Alert: CPUusage = 99, 99, 99 (Max value is 85).

Caché keep a log of cpu usage (99,99,99) and how is the frequency of check of this?

how can i chance the max value? is that possible?

Best,

0 4
0 791

In looking at the Production monitor within Ensemble, I was wondering if there is a way we could customize it for our use. I notice it is basically a dashboard.

For example I would only like to truly display those Services, Processes, and Operations that are truly in dire need of attention. The Monitor out of the box just seems too busy, and I would like to simplify it.

0 2
3 785

Preview releases are now available for the first version (v1.0) of InterSystems System Alerting and Monitoring (InterSystems SAM for short).

InterSystems SAM v1.0 provides a modern monitoring solution for InterSystems IRIS-based products. It allows high-level views of clusters and single-node drilled down metrics-visualization together with alerts notifications. This first version provides visualization for more than one hundred InterSystems IRIS kernel metrics, and users can extend the default-supplied Grafana template to their liking.

V1.0 is meant to be a simple and intuitive baseline. Please help us make it great by trying it and sending us feedback!

SAM can display information from InterSystems-based instance starting with version 2019.4

SAM is only available in container format. You will need the SAM Manager container plus a small set of additional open-source components (Prometheus and Grafana) that are added automatically by the composition file.

SAM components and the SAM Manager Community Edition are available from

If you are traveling or prefer a voice-based Q&A description on what SAM is, here is a podcast we have prepared for you:

https://5e18edf067eb59-03854285.castos.com/player/198587
[This is an embedded link, but you cannot view embedded content directly on the site because you have declined the cookies necessary to access it. To view embedded content, you would need to accept all cookies in your Cookies Settings]

7 2
2 774
Question
· Oct 20, 2016
%UnitTest Code Coverage

Hi,

When we write unit test cases for cache object script code using %UnitTest.TestCase, what is the best way to write code to identify code coverage?

So, let say my unit test case hit all 10 lines of code of a method for a given class. So, unit test coverage should be 100% for that. But, using line-by-line coverage [(%Monitor.System.LineByLine] getting wrong percentage, because it also includes code comment/documentation as part of code. So, practically we can not ever achieve 100% of code coverage by using this API.

2 2
0 756

Can someone direct me to where in the documentation we can find how consumption may be calculated for global storage?

Caché Version2010.1
Operating SystemHP OpenVMS 8.4

EDIT: After receiving some responses, it seems I was unclear in my initial inquiry. I am looking to determine our rate of consumption of storage; however, I am having some difficulty in doing that.

0 6
0 743
Article
· Aug 16, 2023 11m read
Http request response time monitoring

Hi developers!

Today I would like to address a subject that has given me a hard time. I am sure this must have been the case for quite a number of you already (so-called “the bottleneck”). Since this is a broad topic, this article will only focus on identifying incoming HTTP requests that could be causing slowness issues. I will also provide you with a small tool I have developed to help identify them.

Our software is becoming more and more complex, processing a large number of requests from different sources, be it front-end or third-party back-end applications. To ensure optimal performance, it is essential to have a logging system capable of taking a few key measurements, such as the response time, the number of global references and the number of lines of code executed for each HTTP response. As part of my work, I get involved in the development of EMR software as well as incident analysis. Since user load comes mostly from HTTP requests (REST API or CSP application), the need to have this type of measurement when generalized slowness issues occur has become obvious.

13 5
8 730
Question
· Jul 16, 2019
Interface Monitoring

Hi all,

I'm looking to set up monitoring for several interfaces. I understand that I can set an Inactivity Timeout. However, obviously there are messages coming through more frequently during certain hours than other hours.

Is there a way to set an Inactivity Timeout for each hour of the day instead of one value that is used all day long?

Best,

Erin

0 12
3 700

Is it possible to dynamically adjust the RetryInterval andFailureTimeout settings in a BPL?

I've got a business process that calls a web service operation to get a session ID from an external system. There is a string property returned in the body of the response that indicate an exception occurred in the external system. I have code in the BPL that examines the property and sets the status property to an error status when that occurs.

0 3
0 662

Hi All,

With this article, I would like to show you how easily and dynamically System Alerting and Monitoring (or SAM for short) can be configured. The use case could be that of a fast and agile CI/CD provisioning pipeline where you want to run your unit-tests but also stress-tests and you would want to quickly be able to see if those tests are successful or how they are stressing the systems and your application (the InterSystems IRIS backend SAM API is extendable for your APM implementation).

4 0
1 645

We are constantly running into issues where there are billions of Orphaned messages in our system that cause problems, and we have to manually run a cleanup to fix performance issues.

In the following article about orphaned messages... https://community.intersystems.com/post/ensemble-orphaned-messages it mentions either programmatically eliminating the Orphaned messages or using a Utility like Demo.Util.CleanupSet in ENSDEMO.

0 6
1 617
Question
· May 9, 2016
Production Monitor

At the Global Summit several folks had mention that they developed their own production monitor. I am looking to create a monitor similar to eGate that we only display those Services/Processes/Operations that are in trouble, and those Errors that are showing up in the Event Log. Does anyone have any examples of this?

Thanks

Scott Roth

The Ohio State University Wexner Medical Center

0 3
1 580

From time to time, we get the previous question in support, something or someone is using more licenses than expected, and we need to find what.

We have two scenarios. The first scenario is when we realize that the licenses are exhausted when the application does not work or when we try to connect through the terminal and get the "lovely"

<LICENSE LIMIT EXCEEDED> message:

7 1
0 574

Please excuse my ignorance. I am trying to identify what areas would be best to review in the System Dashboard (for Cache 2010.2) for performance issues with the database. It seems to be running slower than usual, but I am trying to find out the best way to go about identifying what the issue is.

The following are captures from the System Dashboard.

As always, thanks a lot for your help.

System Dashboard

2 3
0 556
Article
· Jul 12, 2019 2m read
Basic Database Metrics example

This is a self contained class that can be run from the Intersystems Task Scheduler which records peak usage details for databases and licenses built up throughout the day and retaining 30 days history.

To schedule the task to run every hour:

d ##class(Metrics.Task).Schedule()

You can also specify your own start time, stop time, and run interval:

d ##class(Metrics.Task).Schedule(startTime, stopTime, intervalMins)

Metrics are stored in ^Metrics in the namespace that the class resides in/is run from.

6 3
3 529

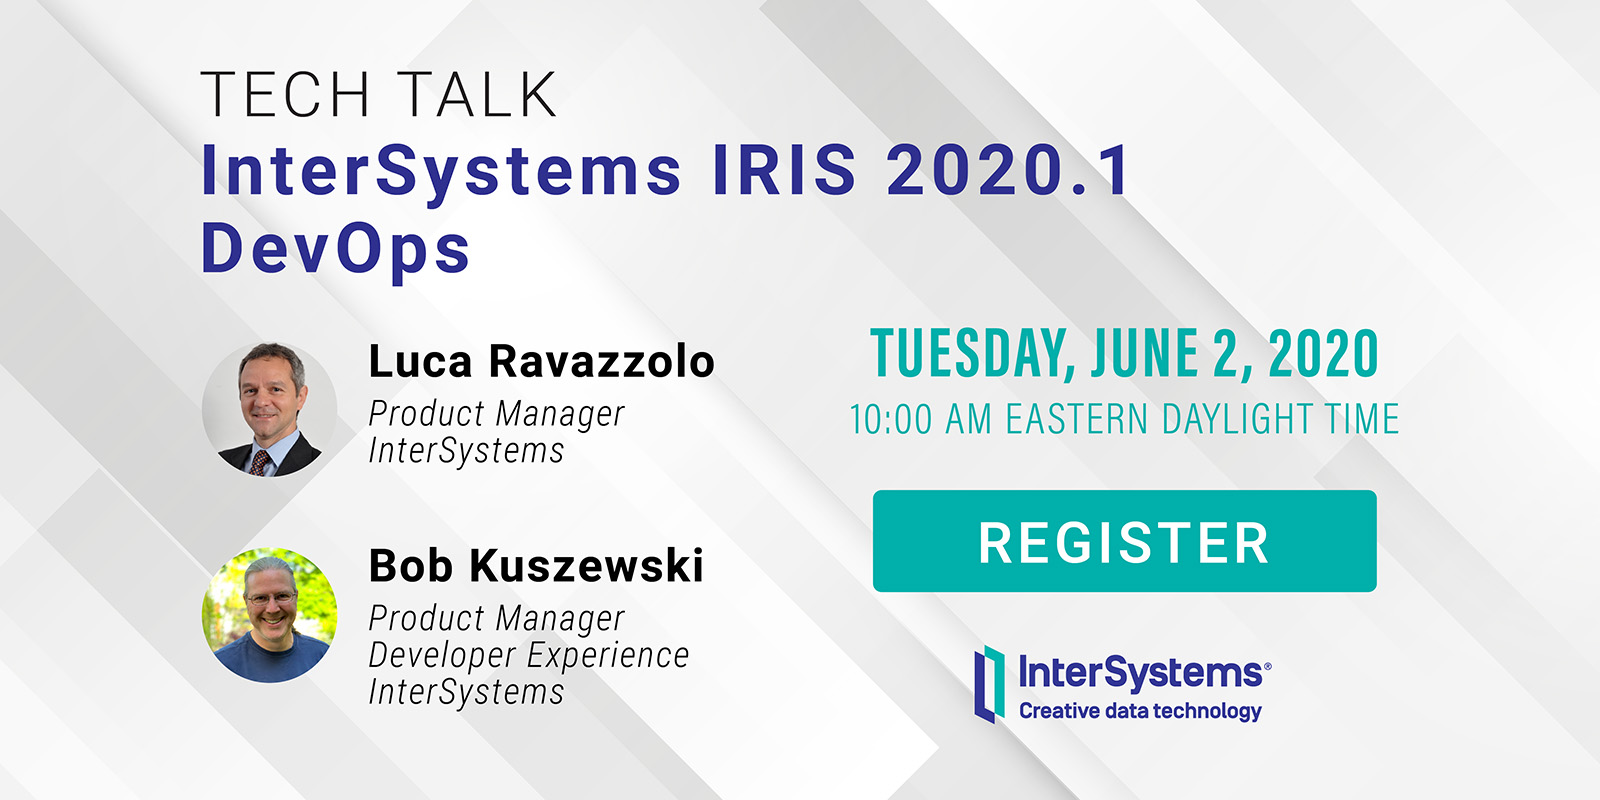
Hey Developers,

We're pleased to invite you to join the next InterSystems IRIS 2020.1 Tech Talk: DevOps on June 2nd at 10:00 AM EDT!

In this InterSystems IRIS 2020.1 Tech Talk, we focus on DevOps. We'll talk about InterSystems System Alerting and Monitoring, which offers unified cluster monitoring in a single pane for all your InterSystems IRIS instances. It is built on Prometheus and Grafana, two of the most respected open source offerings available.

Next, we'll dive into the InterSystems Kubernetes Operator, a special controller for Kubernetes that streamlines InterSystems IRIS deployments and management. It's the easiest way to deploy an InterSystems IRIS cluster on-prem or in the Cloud, and we'll show how you can configure mirroring, ECP, sharding and compute nodes, and automate it all.

Finally, we'll discuss how to speed test InterSystems IRIS using the open source Ingestion Speed Test. This tool is available on InterSystems Open Exchange for your own testing and benchmarking.

4 6
1 529