Enhanced Monitor Manager
Hello Developers!
Previously, I shared with you all a handy operational analytics dashboard you can build to visualize key message processing metrics, such as number of inbound/outbound messages, average processing times, etc.
This time around, I’d like to walk you through an enhanced log monitor using a workflow many of you are already familiar with – working with alerts as messages inside a production, creating routing rules to filter and route alerts, and using pre-built components like the email adapter to send notifications at a granular level.
As you already know, monitoring and managing alerts is the lifeline to ensuring a smooth operation of any application. This becomes even more crucial for Tier 1 applications and integration engines like HealthShare and IRIS for Health powering health systems.
Just as a recap, there are a number of tools available out-of-the-box for monitoring and managing alerts on InterSystems products:
- The Alert Processor gives you the ability to configure custom alerts for interfaces inside a production via a component named Ens.Alert.
- The System Monitor displays real-time status of key production performance indicators.
- The Log Monitor Manager (^MONMGR) utility generates notifications for messages log entries (now known as messages.log, formerly known as cconsole.log) of specified severity level and emails them to specified recipients.
- The Production Monitor illustrates real-time status of the currently running production and its interfaces (input/output connections), queues, active jobs, event log, activity graph, etc.
- The Mirror Monitor displays information about the operating status of a mirror and its members, the mirrored database status, and key mirroring metrics like the incoming journal transfer rate.
The enhanced log monitor I built is very similar to the Log Monitor Manager (^MONMGR) listed above, except now you have a familiar UI to manage and route alerts at a granular level -- every line item written to the Messages Log (messages.log file) is transformed into a message inside a production, relayed to a routing rule named Ens.Alert to granularly filter for specific alerts, and routed to Business Operation components to send notifications via email, text messages, etc. Also, you now can easily edit the recipients of email notifications through the email adapter settings from inside the production.
For example, the Log Monitor Manager (^MONMGR) already provides the ability to alert based on the specified minimum severity level, meaning you can configure email alerts to your system administrator every time there is a log event of severity level 2.
Now with the enhanced log monitor I will describe below, you can further filter down to send an email alert not for all severity level 2 items, but only if an instance failed over to its mirror member (a specific case of severity level 2 item) – this example assumes you have InterSystems Mirroring set up for HA/DR, and this sample production would need to be set up in a non-mirrored namespace on every mirror member.
To use the enhanced log monitor, first download a copy of the sample code from OpenExchange. The downloaded file is an xml file of the sample production you can import directly. To import, go to the Management Portal and navigate to Interoperability->Manage->Deployment Changes->Deploy.

Now, using the “Open Local Deployment” option, open the xml file you downloaded from OpenExchange. Once it is loaded, click “Deploy.”
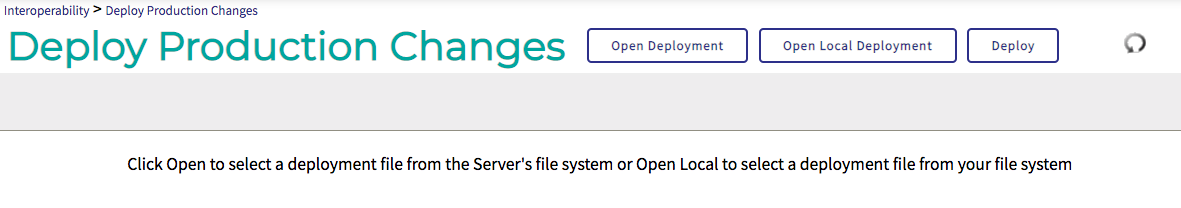
* If you encounter issues importing the production via the Management Portal, please import using Studio.
Let’s navigate to the production you just deployed (Interoperability->List->Productions). Do not start the production until you specify the ^lasttimestamp global explained later. Inside the production, you should see three components:
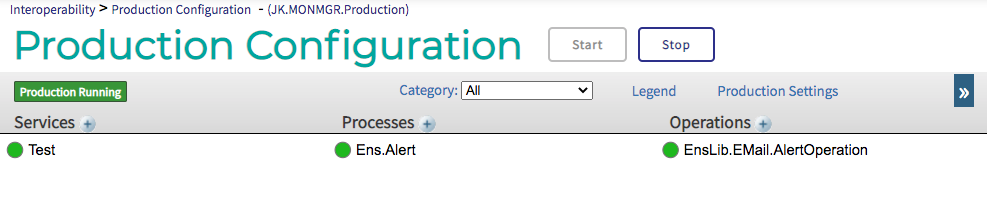
- “Test” Service
- This encapsulates the underlying custom code I implemented – JK.MONMGR.CustomService class. This code continuously checks the messages.log file for new lines being written and creates an Ens.AlertRequest message that gets sent to Ens.Alert for every new line item. Use its adapter setting to set the Call Interval – how often you’d like check for new lines in the Messages Log (messages.log file). To get it as close to real time as possible, choose a small integer like 1 or 5.

- “Ens.Alert” Process
- This is a routing rule named “Ens.Alert” that you can use to route specific alerts (based on Alert Text) from the Messages Log to the “EnsLib.EmailAlertOperation” for sending email notifications. Be sure to change the condition to include the AlertText that you want to alert on (the text inside the double quotes following – Document.AlertText [ “”). Additional rules can be created, and DTLs can also be used to transform alert messages into email templates or other formats of notifications you’d like to send downstream.

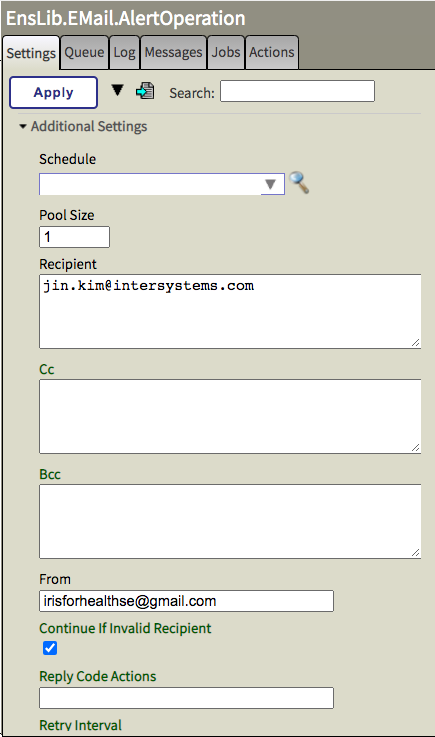
- “EnsLib.EmailAlertOperation” Operation
- This is a pre-built outbound email operation that allows you to directly send email notifications. You can use the adapter settings from the Production Configuration to specify a list of email addresses to send to, your SMTP server/port, Credentials, etc.
* The file path for messages.log is set to "C:\InterSystems\IRISHealth\mgr\messages.log" -- you may need to change this to reflect where your instance's messages.log lives. This line can be found in the OnTask method of JK.MONMGR.CustomService class
Before starting the production, you need to set the ^lasttimestamp global, which keeps track of the timestamp of the last line that was checked by this tool. You need to set it in the format of “MM/DD/YYYY HH:MM:SS” – as an example, from Terminal:
>> set ^lasttimestamp = “08/28/2020 08:00:00”
You are now ready to turn on the production and see this tool in action! Please feel free to adapt the sample code to meet the needs of your organization.
If you have any questions, please comment below or reach out to your account’s Sales Engineer!