APM normally focuses on the activity of the application but gathering information about system usage gives you important background information that helps understand and manage the performance of your application so I am including the IRIS History Monitor in this series.

In this article I will briefly describe how you start the IRIS or Caché History Monitor to build a record of the system level activity to go with the application activity and performance information you gather. I will also give examples of SQL to access the information.

6 3
3 1.8K

In last week's discussion we created a simple graph based on the data input from one file. Now, as we all know, sometimes we have multiple different datafiles to parse and correlate. So this week we are going to load additional perfmon data and learn how to plot that into the same graph.
Since we might want to use our generated graphs in reports or on a webpage, we'll also look into ways to export the generated graphs.

5 0
0 1.1K

Welcome to the next chapter of my CI/CD series, where we discuss possible approaches toward software development with InterSystems technologies and GitLab.
Today, we continue talking about Interoperability, specifically monitoring your Interoperability deployments. If you haven't yet, set up Alerting for all your Interoperability productions to get alerts about errors and production state in general.

Inactivity Timeout is a setting common to all Interoperability Business Hosts. A business host has an Inactive status after it has not received any messages within the number of seconds specified by the Inactivity Timeout field. The production Monitor Service periodically reviews the status of business services and business operations within the production and marks the item as Inactive if it has not done anything within the Inactivity Timeout period.
The default value is 0 (zero). If this setting is 0, the business host will never be marked Inactive, no matter how long it stands idle.

5 1
0 1.3K
Article
· Jun 9, 2016 1m read
Ensemble monitoring

First post! In order to somewhat redeem myself for an unnecessary call to support, I've decided to post some classes that I've written to monitor certain metrics inside our Ensemble Live instance (yeah, Kyle, you WERE laughing at me, but it's okay). What the classes do is to run queries and code to get database sizes, status of the mirror, counts of rows in tables such as EnsLib.HL7.Message and Ens.MessageHeader. The data is collected and written to tables and then an email is sent out daily upon completion. I've found this quite useful in keeping an eye on what's going on. It's help

5 5
1 965

When you have been using cubes for business intelligence in a namespace for some time, you may find that there are many cubes in the namespace, only some of which are actively being used. However, it can be difficult to tell which cubes users are or are not querying, and maintaining unused cubes can be costly both in terms of storage and of computation to keep them up to date. This article provides some suggestions and examples for monitoring which cubes are in active use, and for removing cubes that you determine are no longer necessary.

5 2
3 533
Article
· Feb 7, 2023 3m read
IRIS Queue monitoring component

1. Overview

With more and more hospital applications built, business interface data processing may be affected by a variety of factors (network, consumer systems, etc.), there is an excessive accumulation of messages or even cause interface lag, affecting the routine performance of hospital IT systems , so the monitoring of the business interface components queue is increasingly important.

While current Intersystems IRIS platform's built-in queue monitoring only displays real-time queue information for interface components, which is limited in providing the queue data information needed by hospitals. The queue monitoring component program is based on the Intersystems IRIS platform and can monitor all interface components and display component queue information within 24h of the component, as well as query component historical queue data by setting a time period to better meet the needs of current in-hospital applications.

4 1
0 327

Hi All,

With this article, I would like to show you how easily and dynamically System Alerting and Monitoring (or SAM for short) can be configured. The use case could be that of a fast and agile CI/CD provisioning pipeline where you want to run your unit-tests but also stress-tests and you would want to quickly be able to see if those tests are successful or how they are stressing the systems and your application (the InterSystems IRIS backend SAM API is extendable for your APM implementation).

4 0
1 731

One of the topics that comes up often when managing Ensemble productions is disk space:

The database (the CACHE.DAT file) grows in a rate that was unexpected; or the Journal files build up at a fast pace; or the database grows continuously though the system has a scheduled purge of the Ensemble runtime data.

It would have been better if these kind of phenomena would have been observed and accounted for yet at the development and testing stage rather than on a live system.

For this purpose I created a basic framework that could aid in this task.

4 7
2 1.4K

Some Usage cases

1. A deployment may consist of two high availability instances and two disaster recovery instances in a different data center.

The corresponding UAT environment could replicate this giving a total of 8 instances. How do you confirm CPF and Scheduled task alignment across ALL instances.

3 2
0 449
Article
· Feb 3, 2023 3m read
Queue monitoring

Overview

With the gradual improvement of hospital information construction, there are more and more business interfaces in hospitals. Due to the influence of various factors (network, consumer system, etc.), the data processing of business interface may cause excessive message accumulation and even the situation of interface card congestion, which affects the normal business development in the hospital. Therefore, the monitoring of the queue of business interface components becomes more and more important.

3 2
0 494
Article
· Aug 2, 2020 1m read
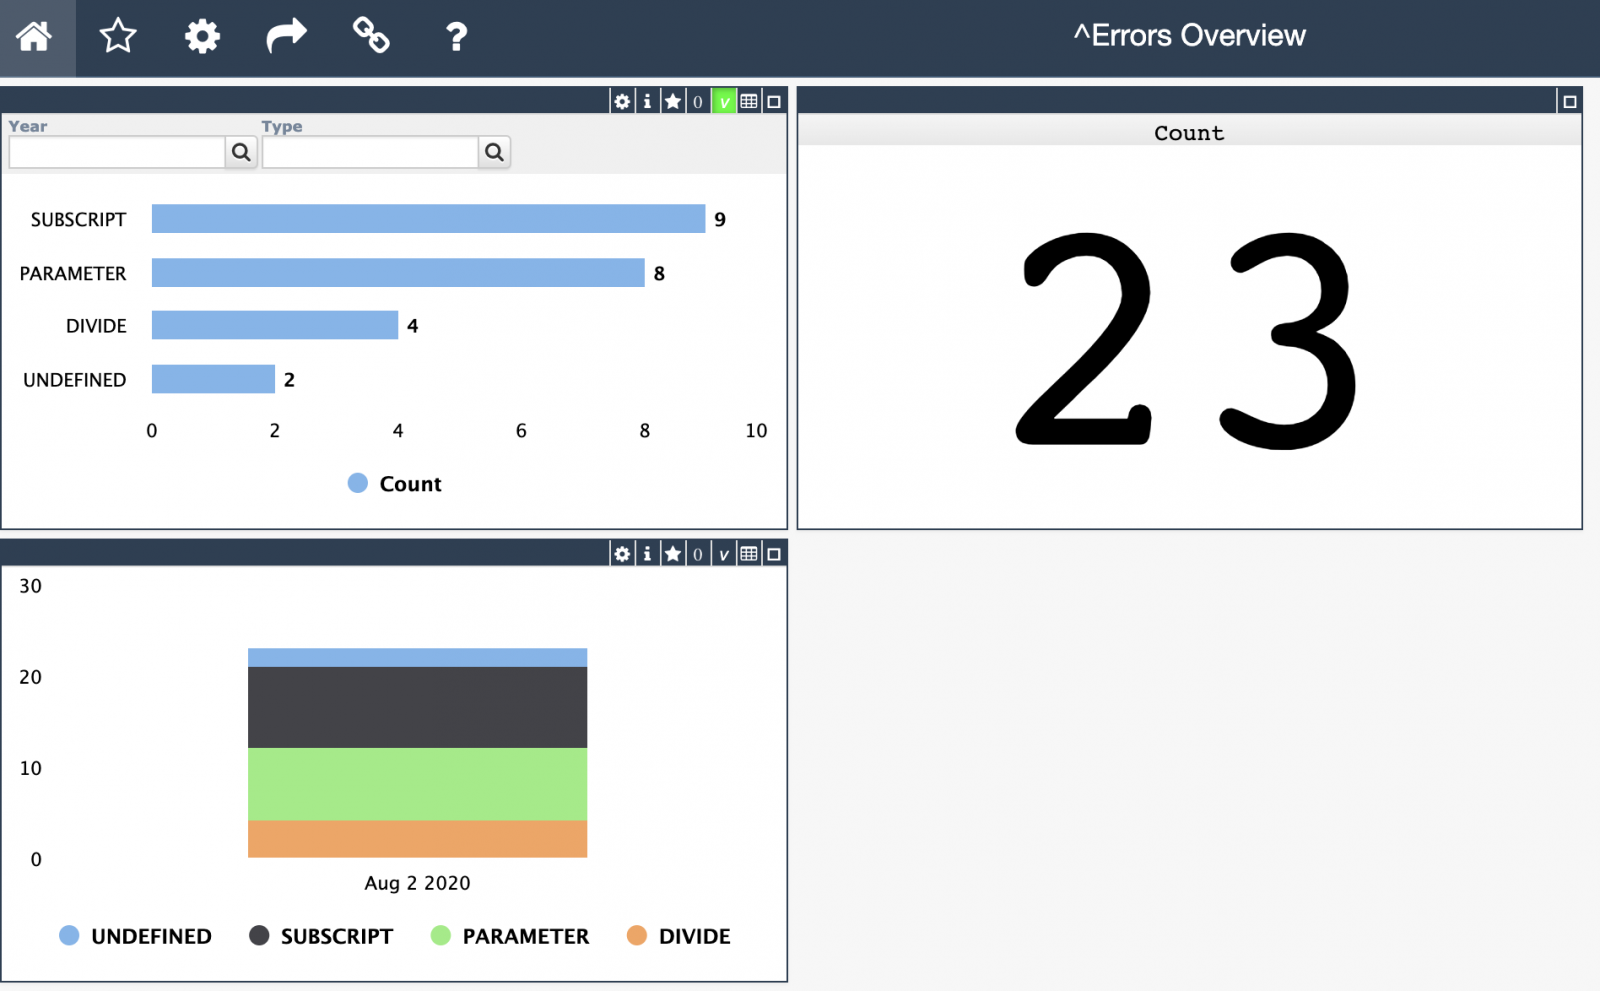
Application Errors Analytics

Hi Developers!

As you know the application errors live in ^ERRORS global. They appear there if you call:

d e.Log() 

in a Catch section of Try-Catch.

With @Robert.Cemper1003's approach, you can now use SQL to examine it.

Inspired by Robert's module I introduced a simple IRIS Analytics module which shows these errors in a dashboard:

3 5
1 363

The MONITOR process (also called the Caché Monitor) scans the messages in your cconsole.log file and sends you emails based on the severity of those messages. The MONITOR is configured using the ^MONMGR utility in terminal.

The MONITOR should not be confused with the similarly named System Monitor, which checks a variety of system health and performance metrics and can log messages regarding them to the cconsole.log, where they can then be scanned by the MONITOR.

2 6
2 1.4K

So if you are following from the previous post or dropping in now, let's segway to the world of eBPF applications and take a look at Parca, which builds on our brief investigation of performance bottlenecks using eBPF, but puts a killer app on top of your cluster to monitor all your iris workloads, continually, cluster wide!

Continous Profiling with Parca, IRIS Workloads Cluster Wide

2 0
1 213
Article
· Jan 15, 2016 1m read
Activity Monitor in Ensemble 2016.1

Has anyone tried the new Activity Volume Statistics and Monitoring in Ensembel 2016.1? I would love to get some feedback.

If you haven't read about this, there is a dashboard that provides counts and response times for messages sent and received by each configuration item. Alternatively the underlying data is arranged in tables that should make it easy for you to use your favorite SQL reporting tools to generate reports for short term performance monitoring or longer term capacity planning.

Dave

0 9
2 1.1K

Presenter: Kerry Kirkham
Task: Prevent application-to-application interface problems from escalating
Approach: Give examples of using alerts to get the right person working on a problem as soon as possible

Problems with application-to-application interfaces are inevitable but in most cases they can be fixed with little disruption as long as the right person gets to know about it as soon as possible. But delays in attention cause problems to escalate, pressure mounts and business suffers. This session looks at how monitoring and alerting can be set up to recognize problems and get the right person working on the problem in the shortest possible time so that small problems don’t turn into major issues.

Solution: Using alerts to minimize interface problems

Content related to this session, including slides, video and additional learning content can be found here.

0 0
0 317

Presenter: Luca Ravazzolo
Task: Track the status and performance of clustered environments
Approach: Give examples of using modern technology to spot potential bottlenecks before they turn into problems

This session will discuss how modern technology can be used to keep track of the status and performance of your cloud clustered environments.

Content related to this session, including slides, video and additional learning content can be found here.

0 0
0 295

Presenter: Barry Cooper
Task: Enable users to perform analytics within an application and take actions based on those analytics
Approach: Provide examples of embedding DeepSee within applications

Analytics is more than just using data to provide insight. Analytics is about taking action on that insight. See examples of how you can embed DeepSee in your applications, allowing you to take action.

Content related to this session, including slides, video and additional learning content can be found here.

0 0
0 178