By replies
 Open Exchange app
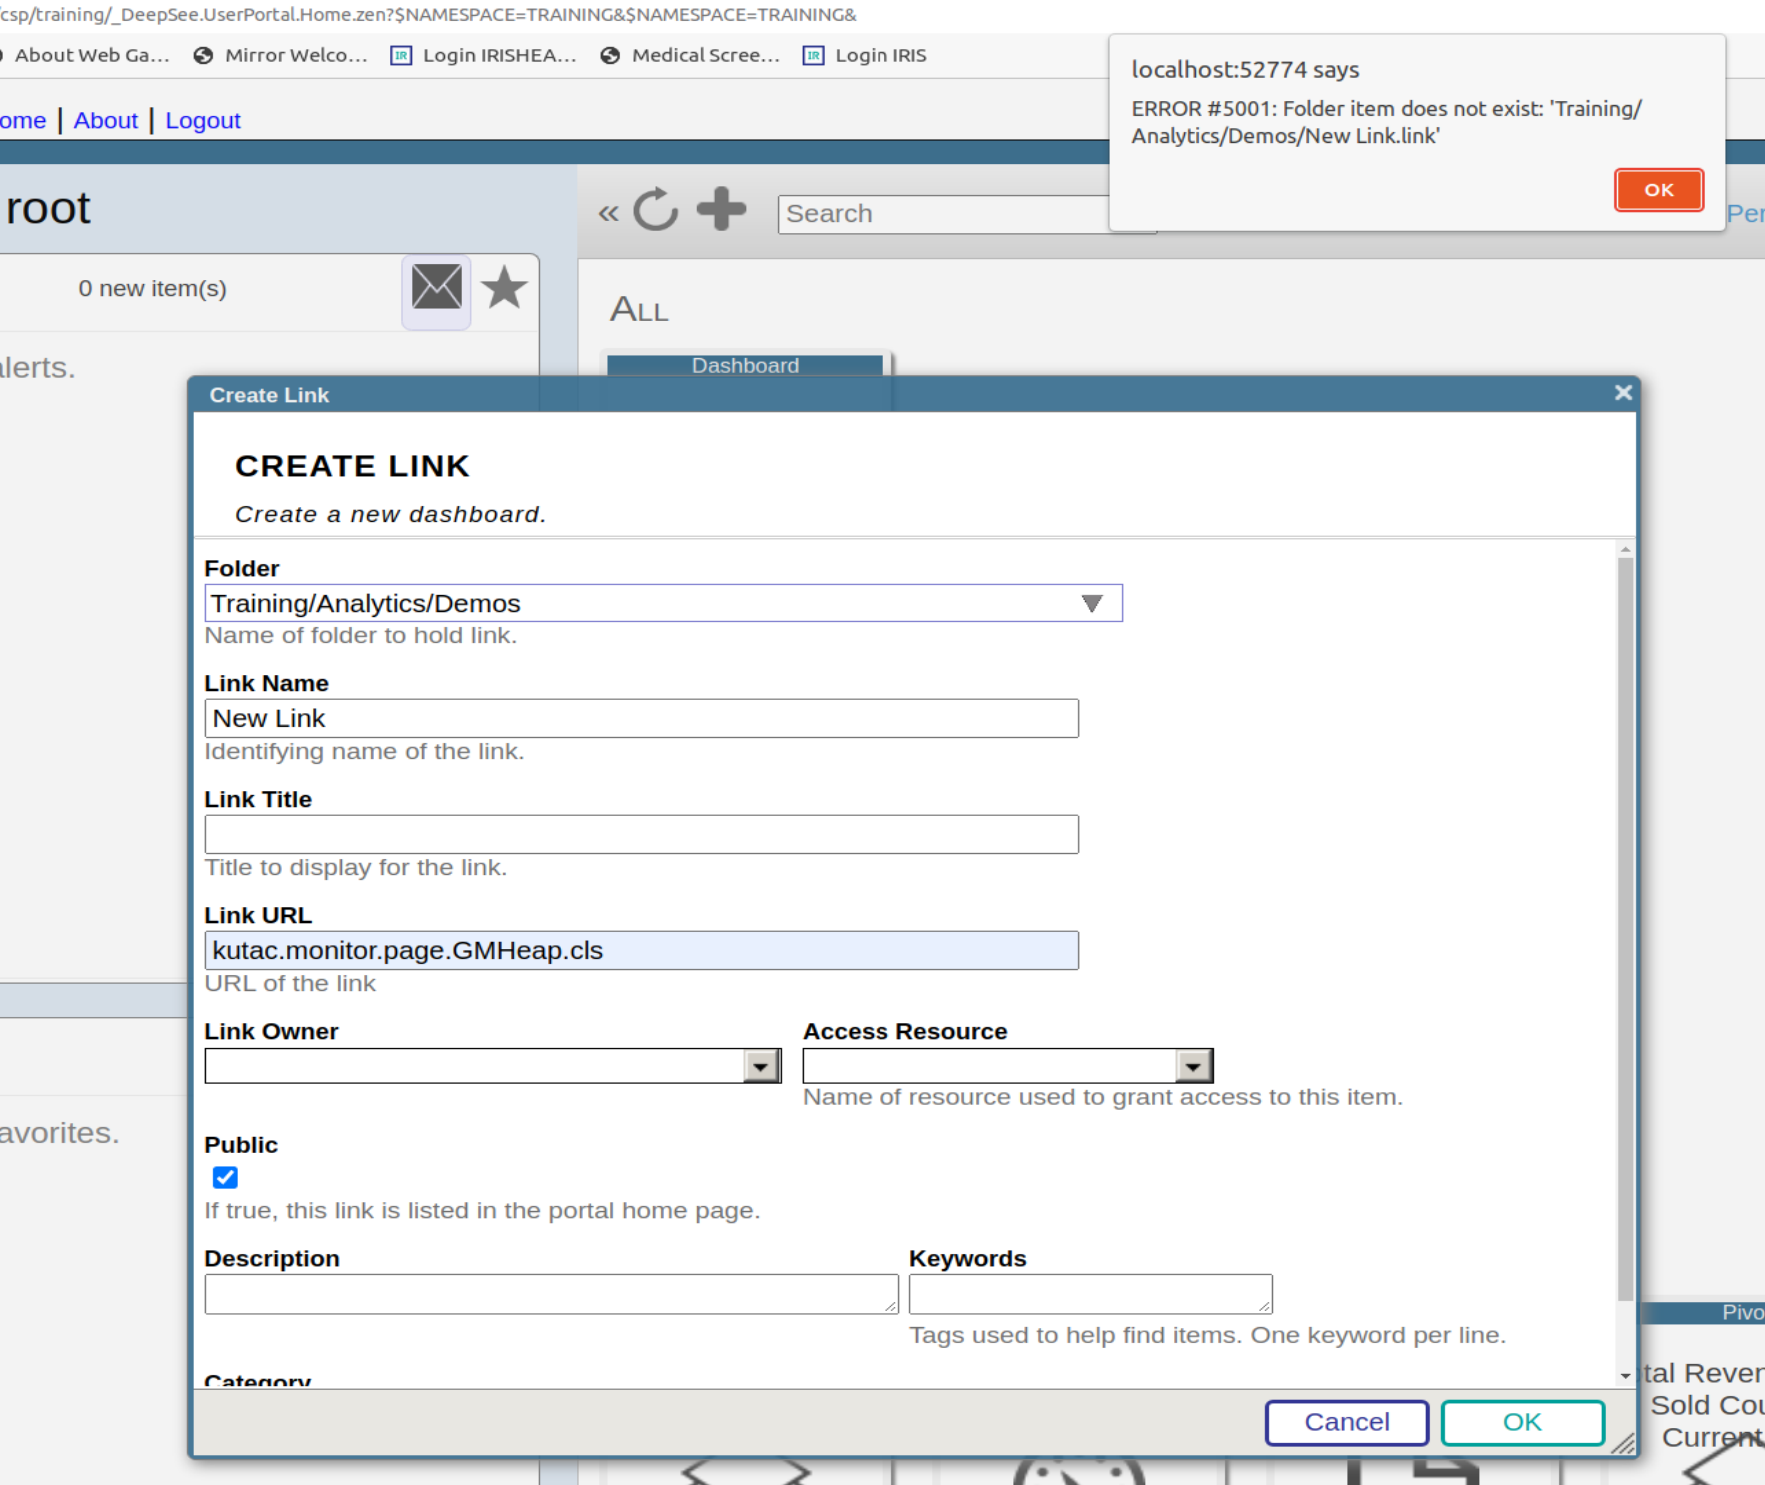
Has anybody tried to extend the Menu on Management Portal? I like to add a new page or a dashboard that will be created soon to the Management Portal and allow others to use it also. I understand there are risks that I could lose things during an upgrade. I am okay with that. Does InterSystems support such an effort?