Dashboard IRIS History Monitor
Hi, everyone!
I want to share a personal project that started with a simple request at work:
Is it's possible to know how many Caché licenses we are using?
Reading other articles here in the community, I found this excellent article by David Loveluck
APM - Using the Caché History Monitor
https://community.intersystems.com/post/apm-using-cach%C3%A9-history-monitor
So, using David's article, I started using Caché History Monitor and to show all that information.
When facing the question: Which cool tech should I use?
My decision was CSP, simple and powerful, so the customer that I'm working for can realize that Caché it's more than just MUMPS/Terminal.
After creating the pages to show the history of Licensing, Database Growth, and CSP Sessions, I've decided to create a new design for the System Dashboard and Processes page.
Everything works great with my Caché instance.
However, how about IRIS?
Following the article by Evgeny Shvarov
Using Docker with your InterSystems IRIS development repository
https://community.intersystems.com/post/using-docker-your-intersystems-iris-development-repository
I dockerized and put the code on GitHub, so now, everyone can try with a few steps.
How to Run
To start coding with this repo, you do the following:
1. Clone/git pull the repo into any local directory$ git clone https://github.com/diashenrique/iris-history-monitor.git
2. Open the terminal in this directory and run:$ docker-compose build
3. Run the IRIS container with your project:$ docker-compose up -d
How to test
Open the browser and go
Ex.: http://localhost:52773/csp/irismonitor/dashboard.csp
The username _SYSTEM can run the dashboard and the other features.
System Dashboard
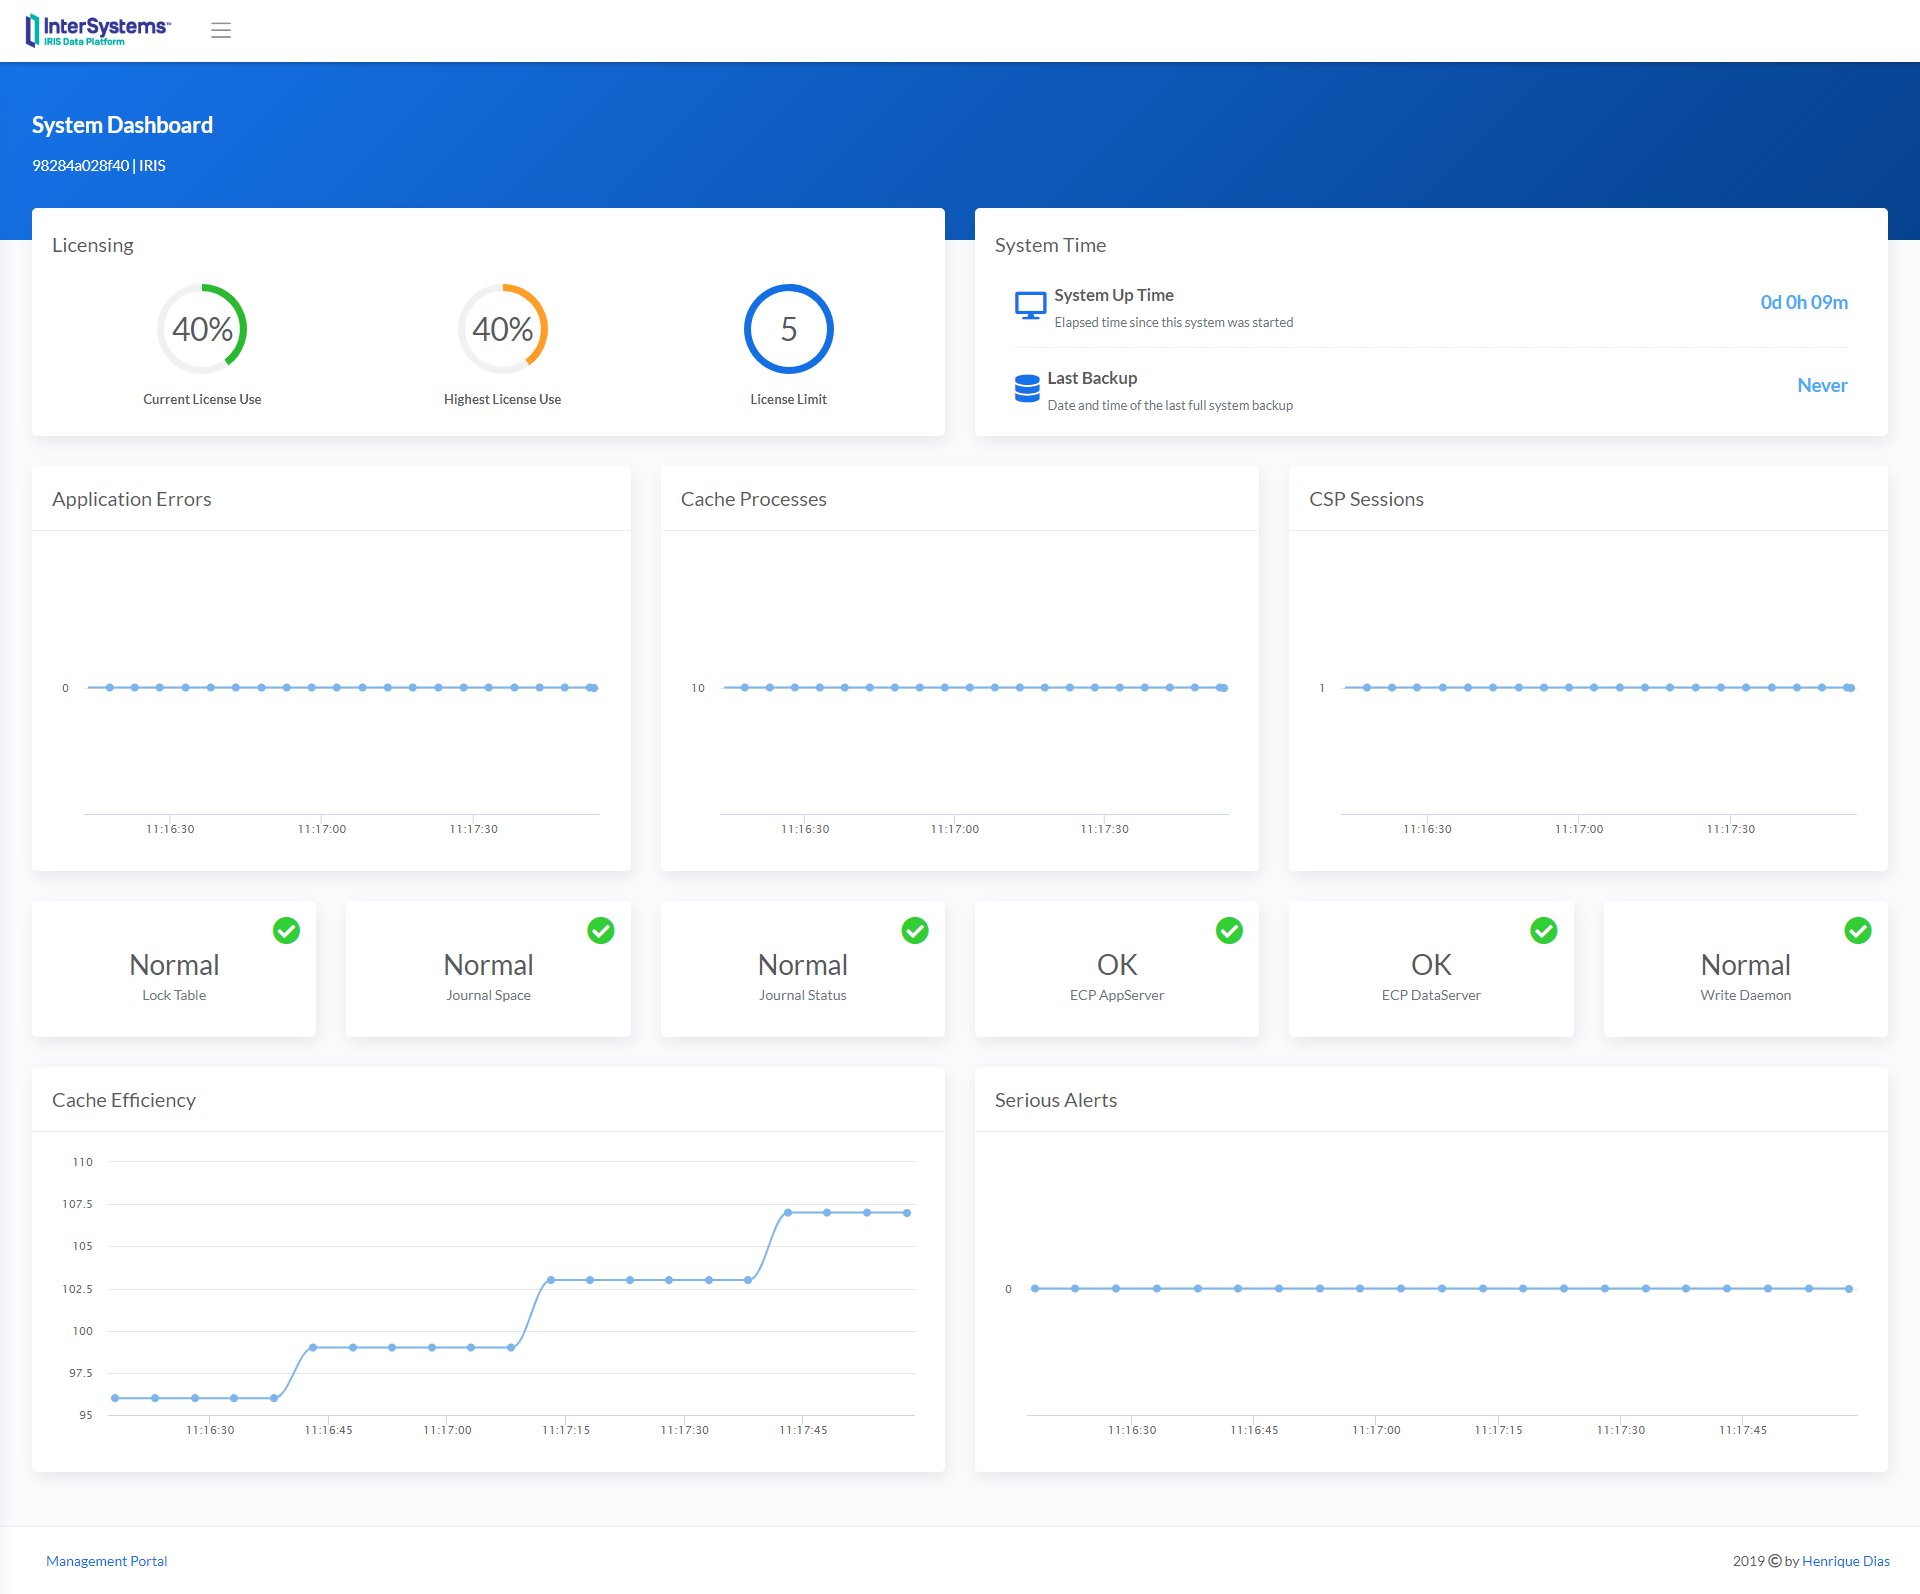
System Dashboard shows the following items:
- Licensing
- System Time
- Application Errors
- Cache Processes
- CSP Sessions
- Lock Table
- Journal Space
- Journal Status
- ECP AppServer
- ECP DataServer
- Write Daemon
- Cache Efficiency
- Serious Alerts
The line charts widgets plot a point every 5 seconds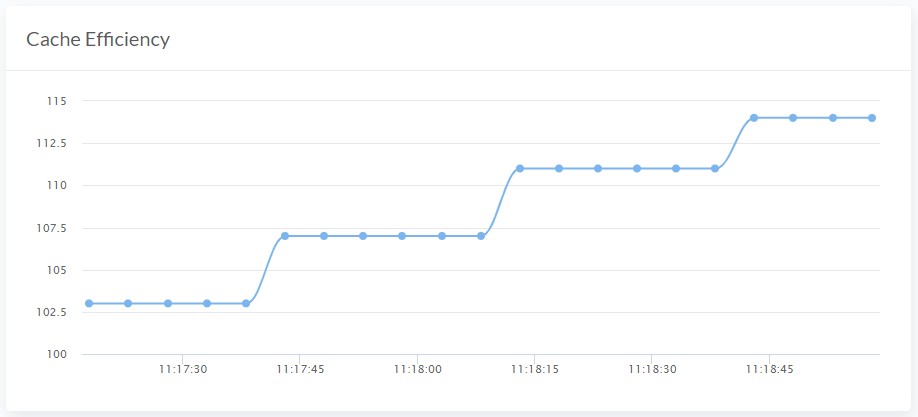
System Menu
System Processes
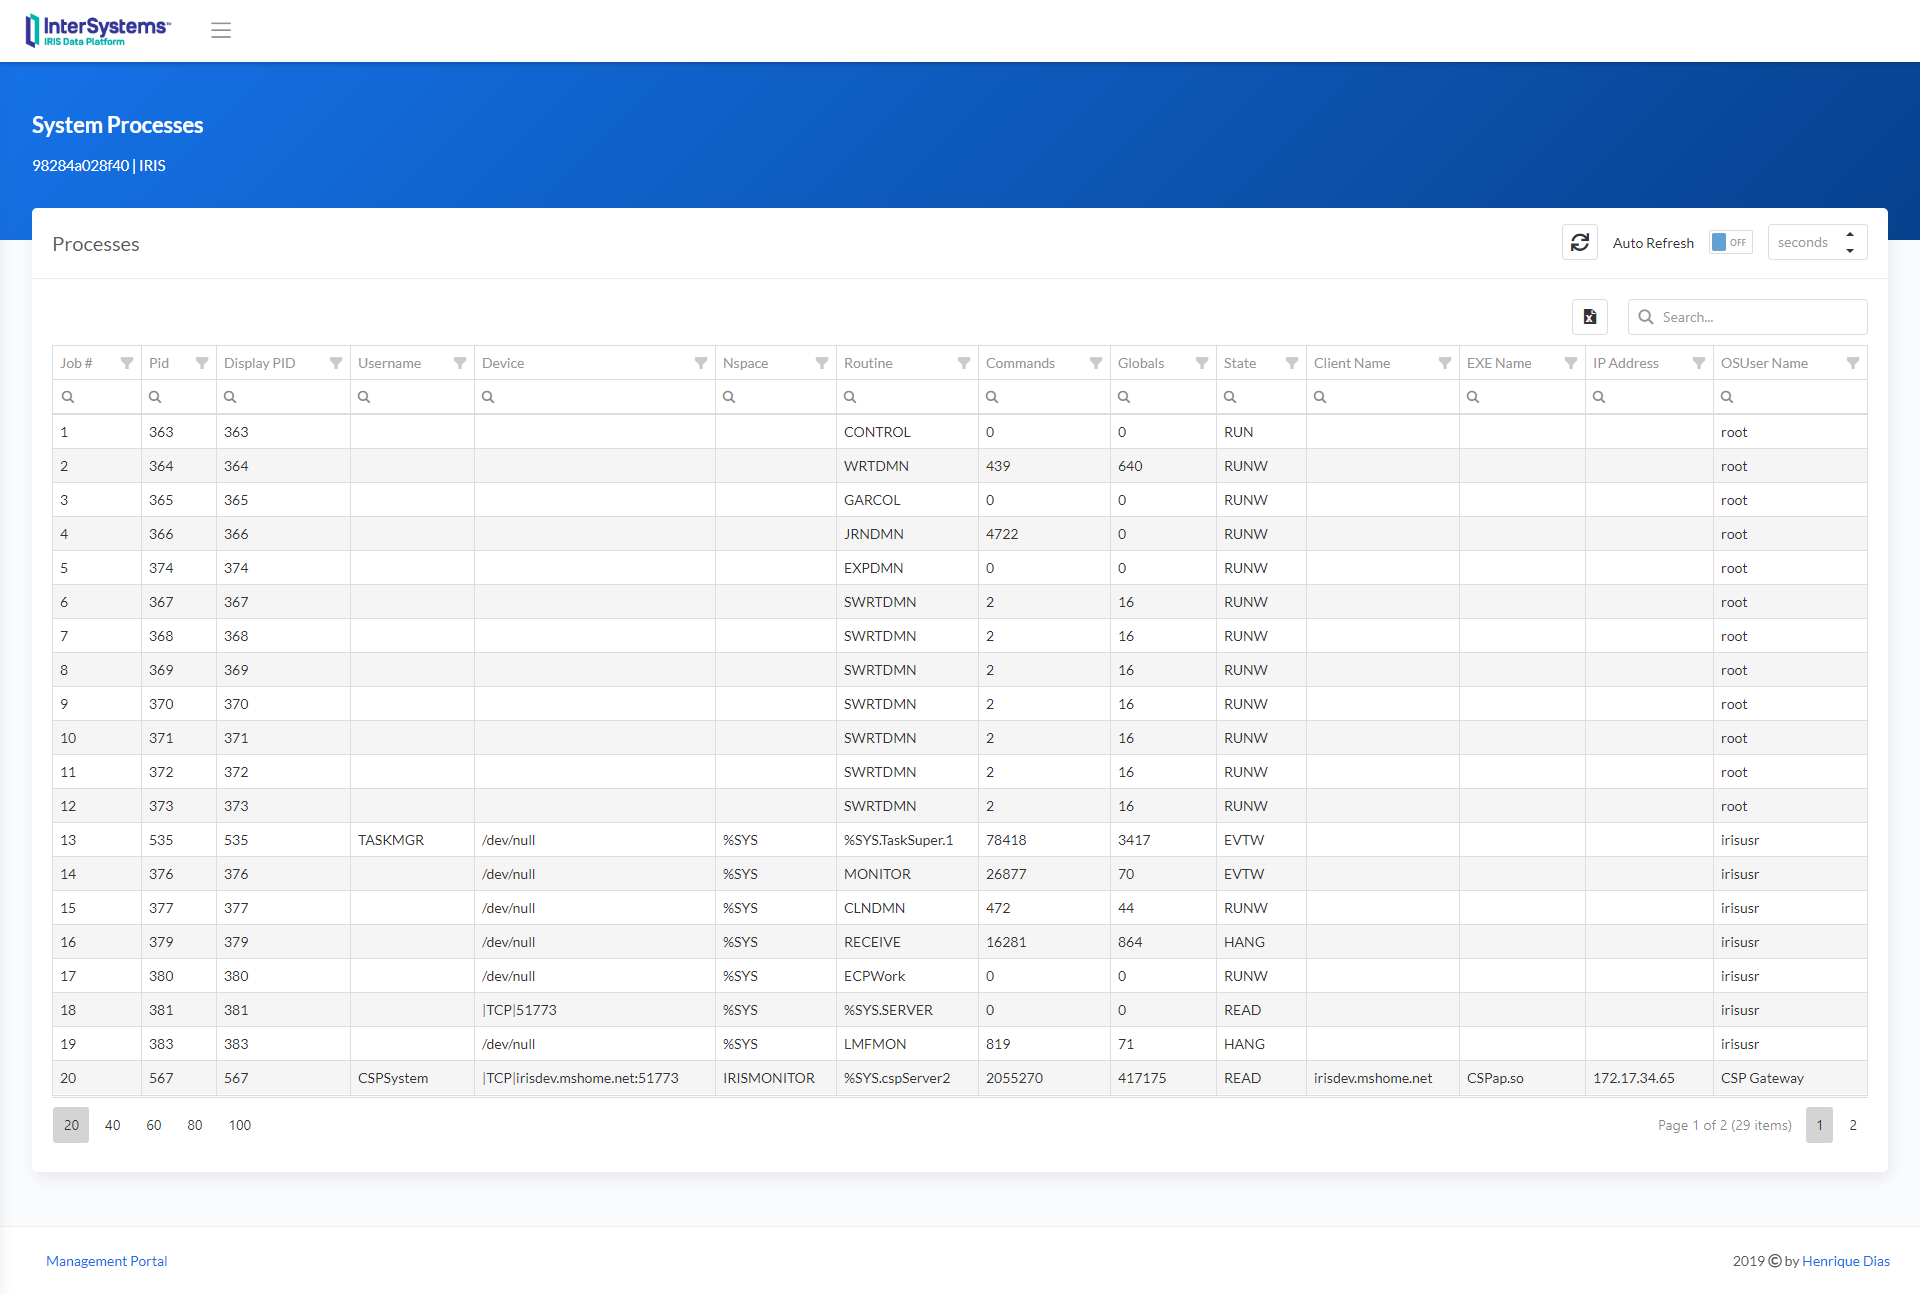
Processes Filters
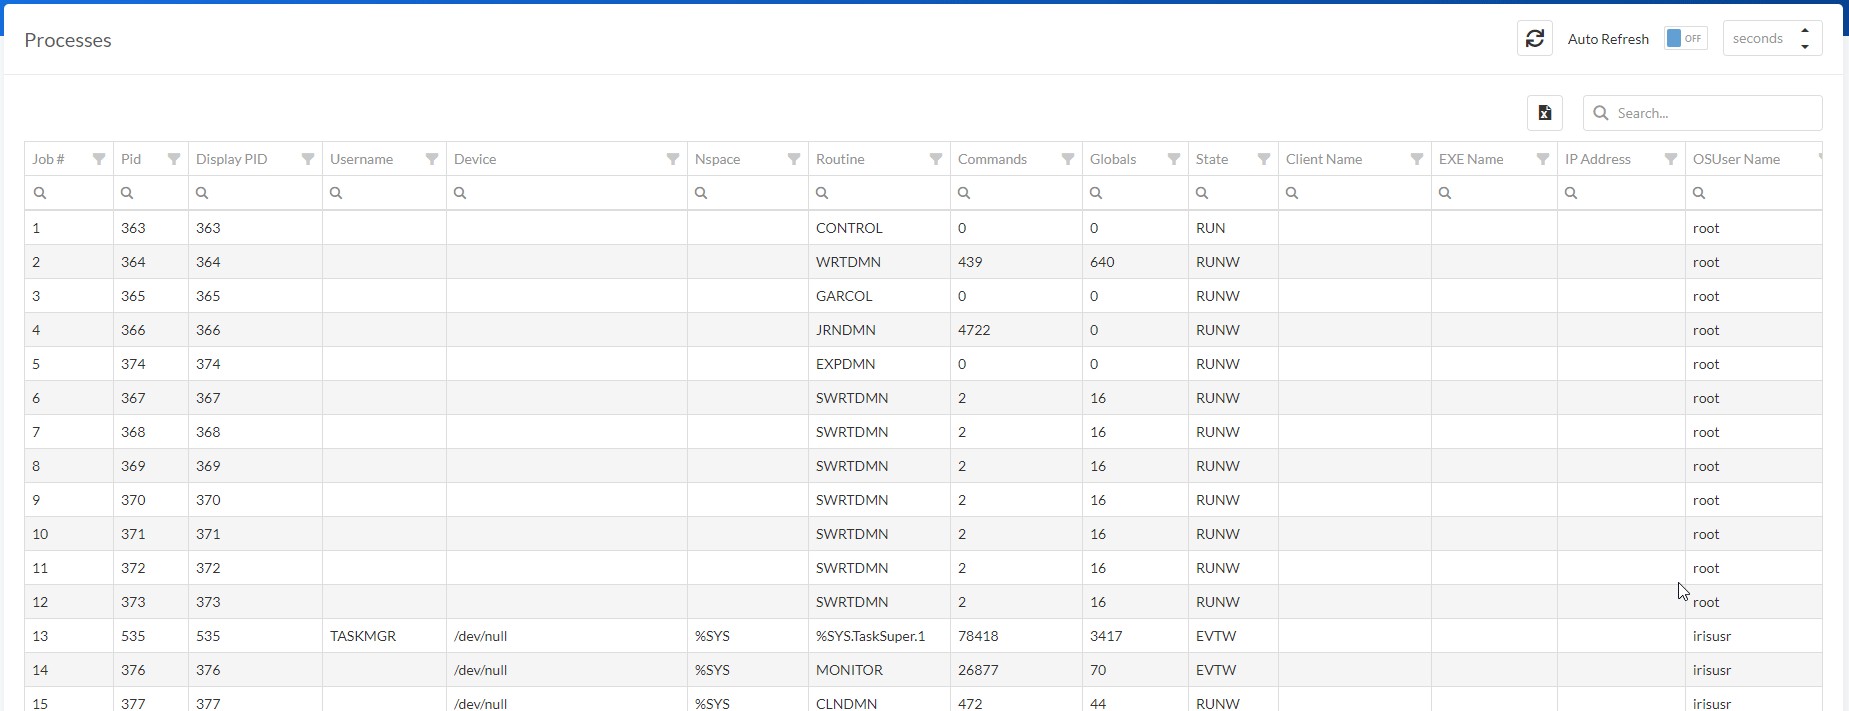
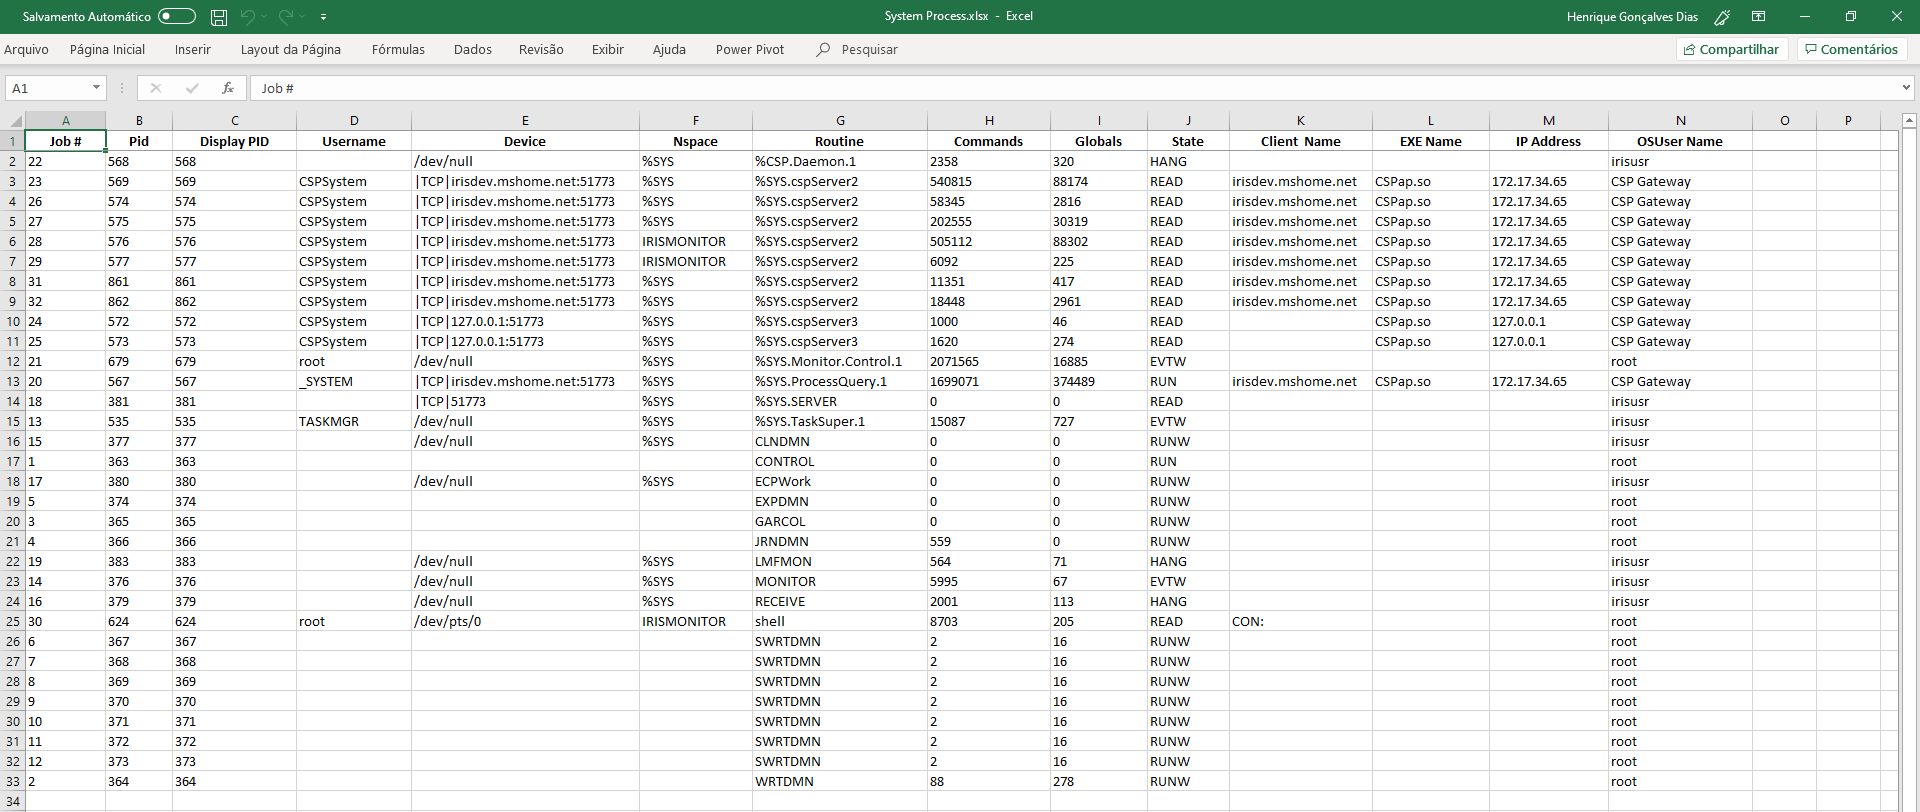
Use different filters to achieve the result that you need. You can also use Multiple Sorts, pressing Shift + clicking on the column header. And even export the data grid to Excel!
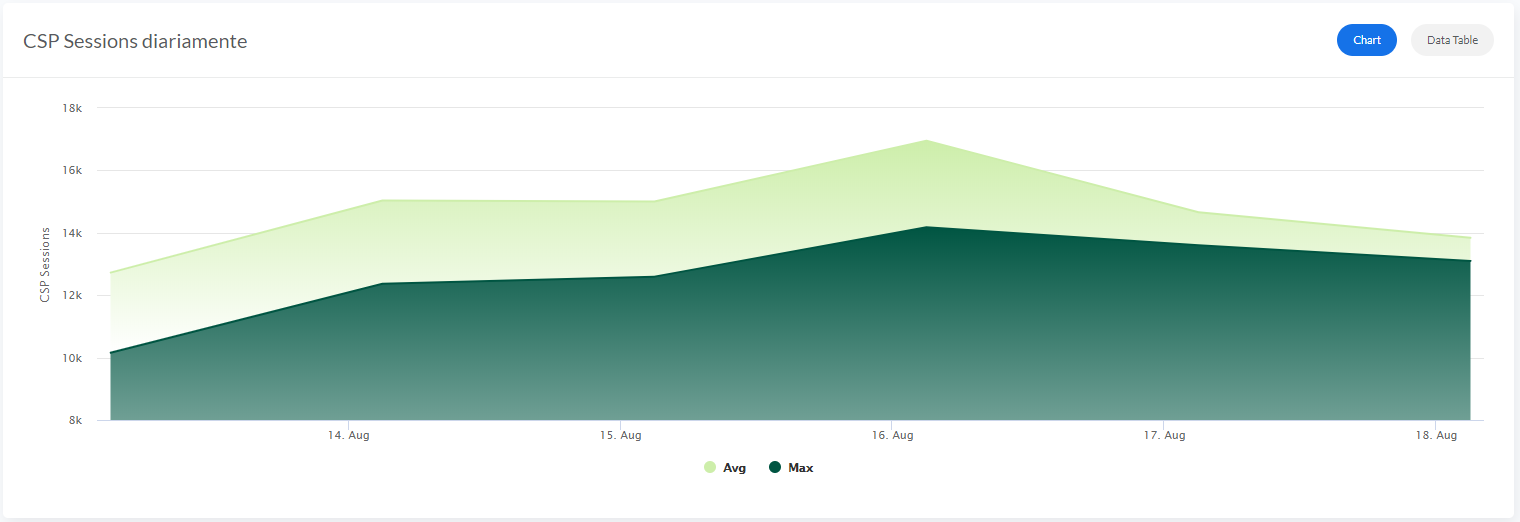
History Monitor
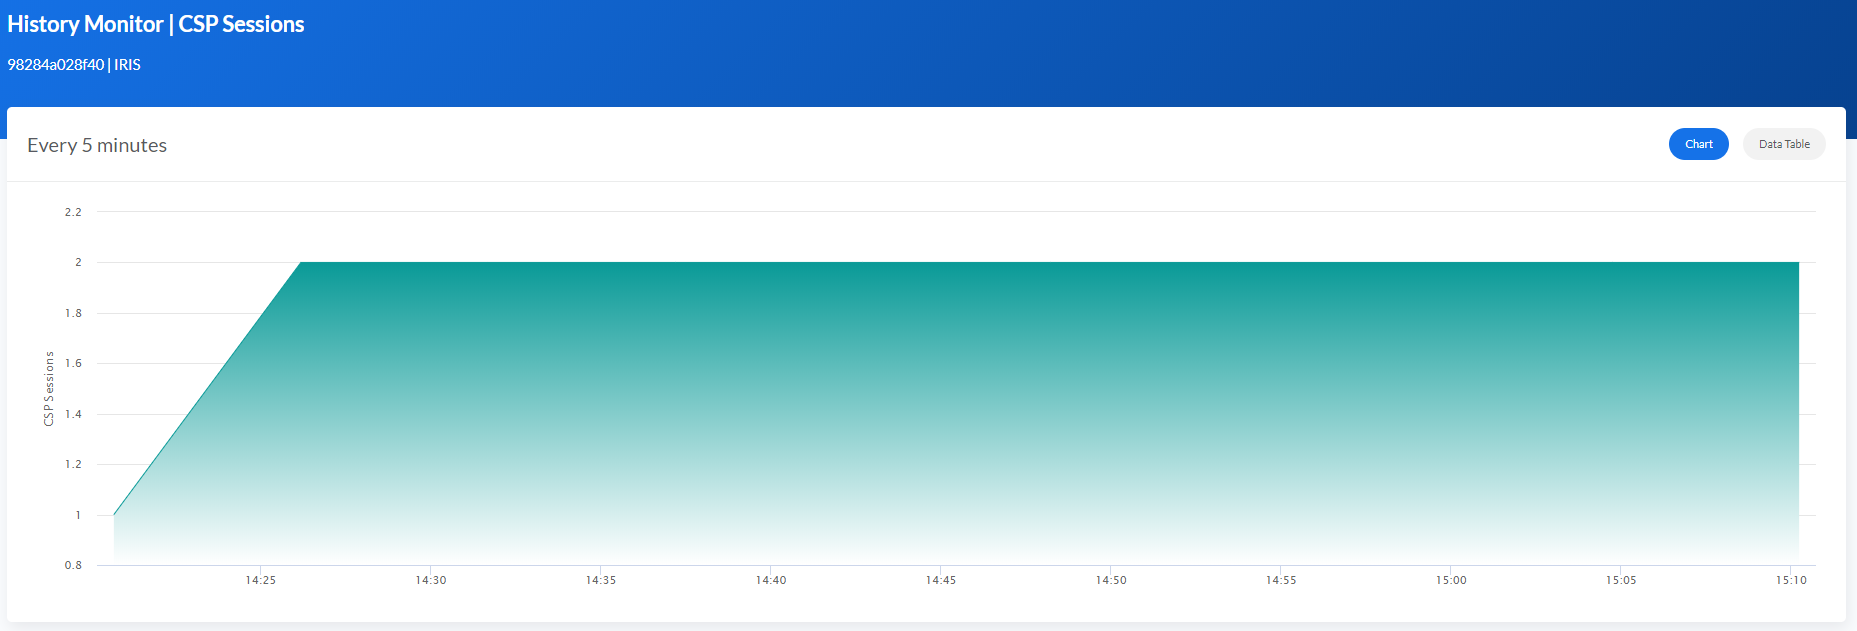
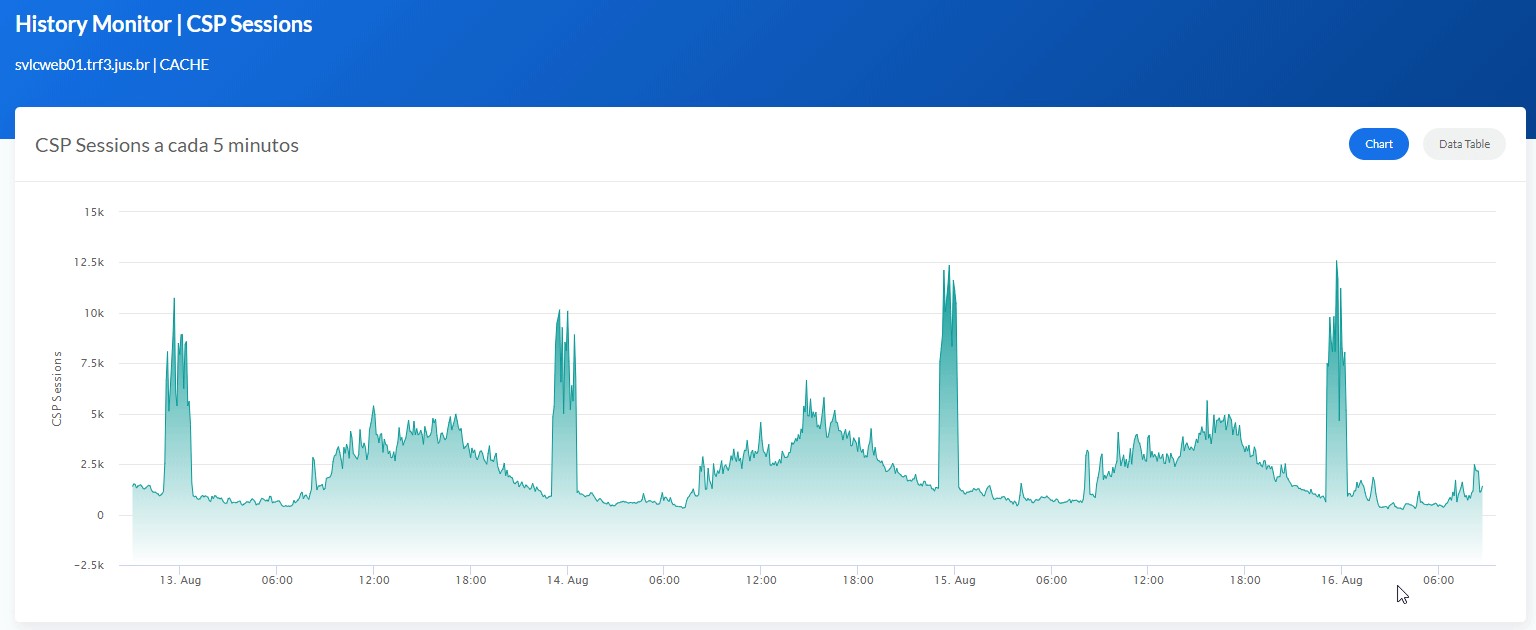
The History Monitor for CSP Sessions and Licensing shows the information between three sections:
- Every 5 Minutes
- Daily
- Hourly
Database Growth only shows Daily information.
The history pages share the features below:
Date Range Picker
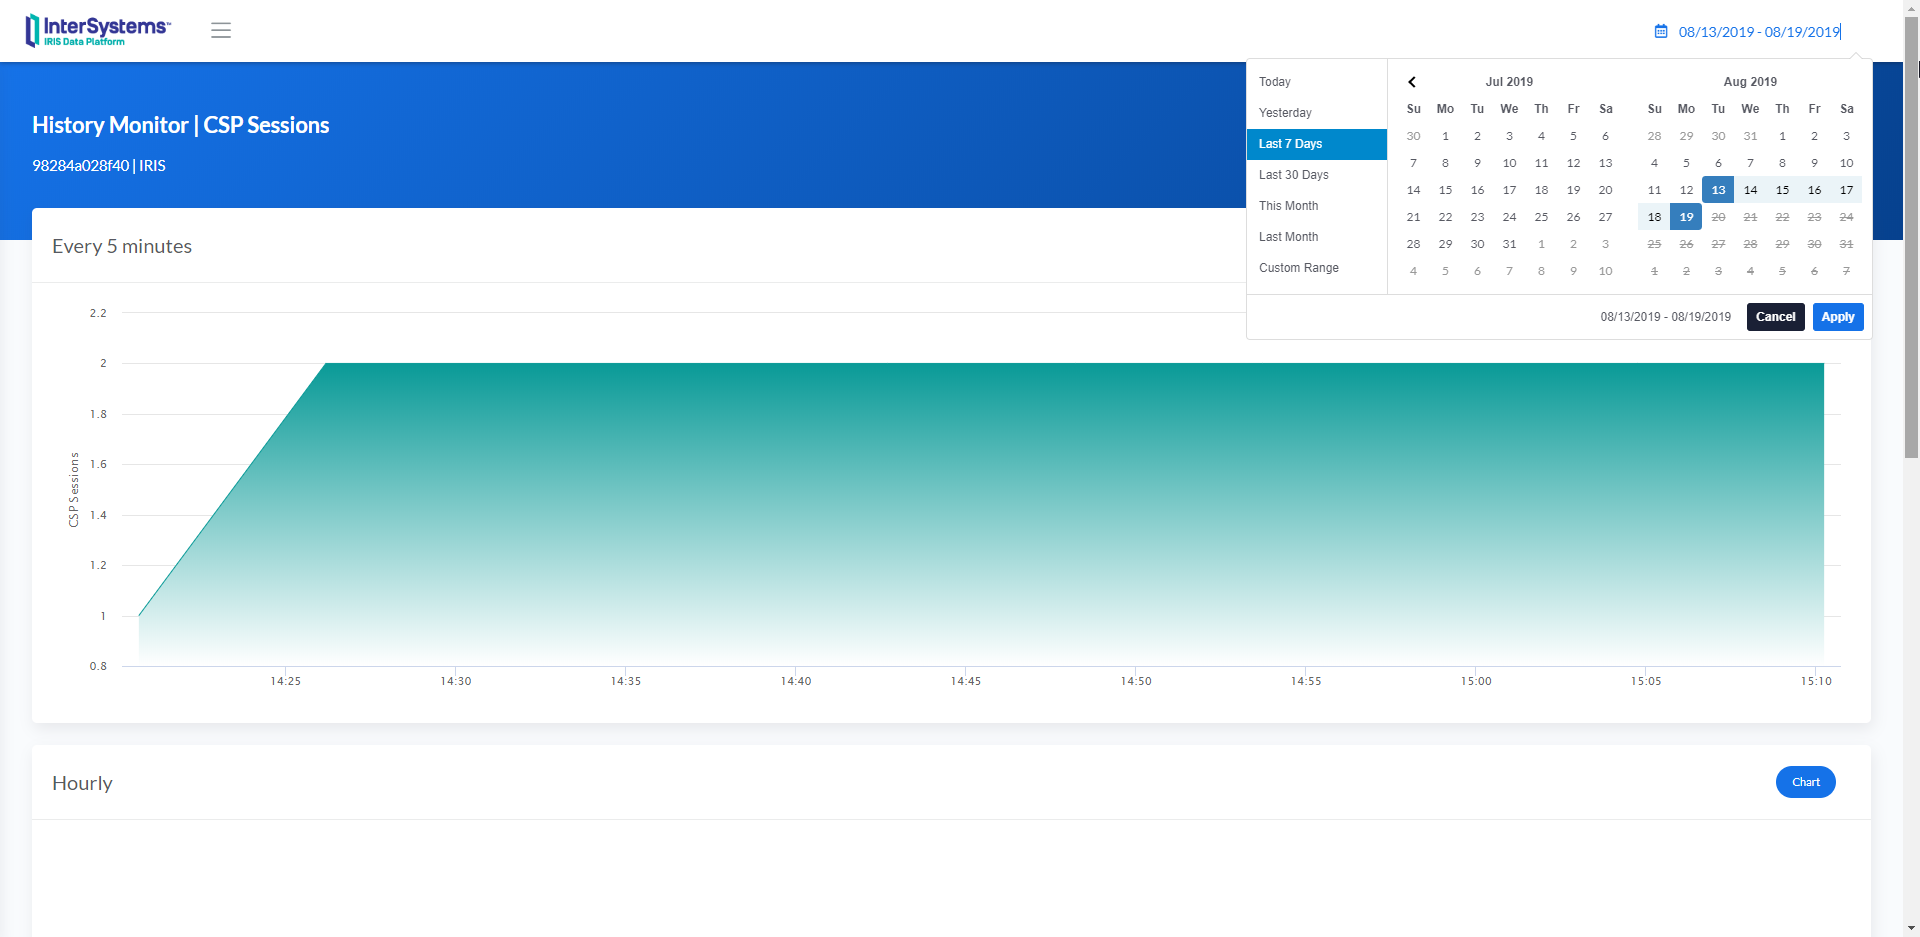
The default value is "Last 7 Days."
Chart / Data Table
On the top right of every each section, there are two buttons (Chart/Data Table)
The Data Table shows the information that creates the chart, and you can also download in Excel format.
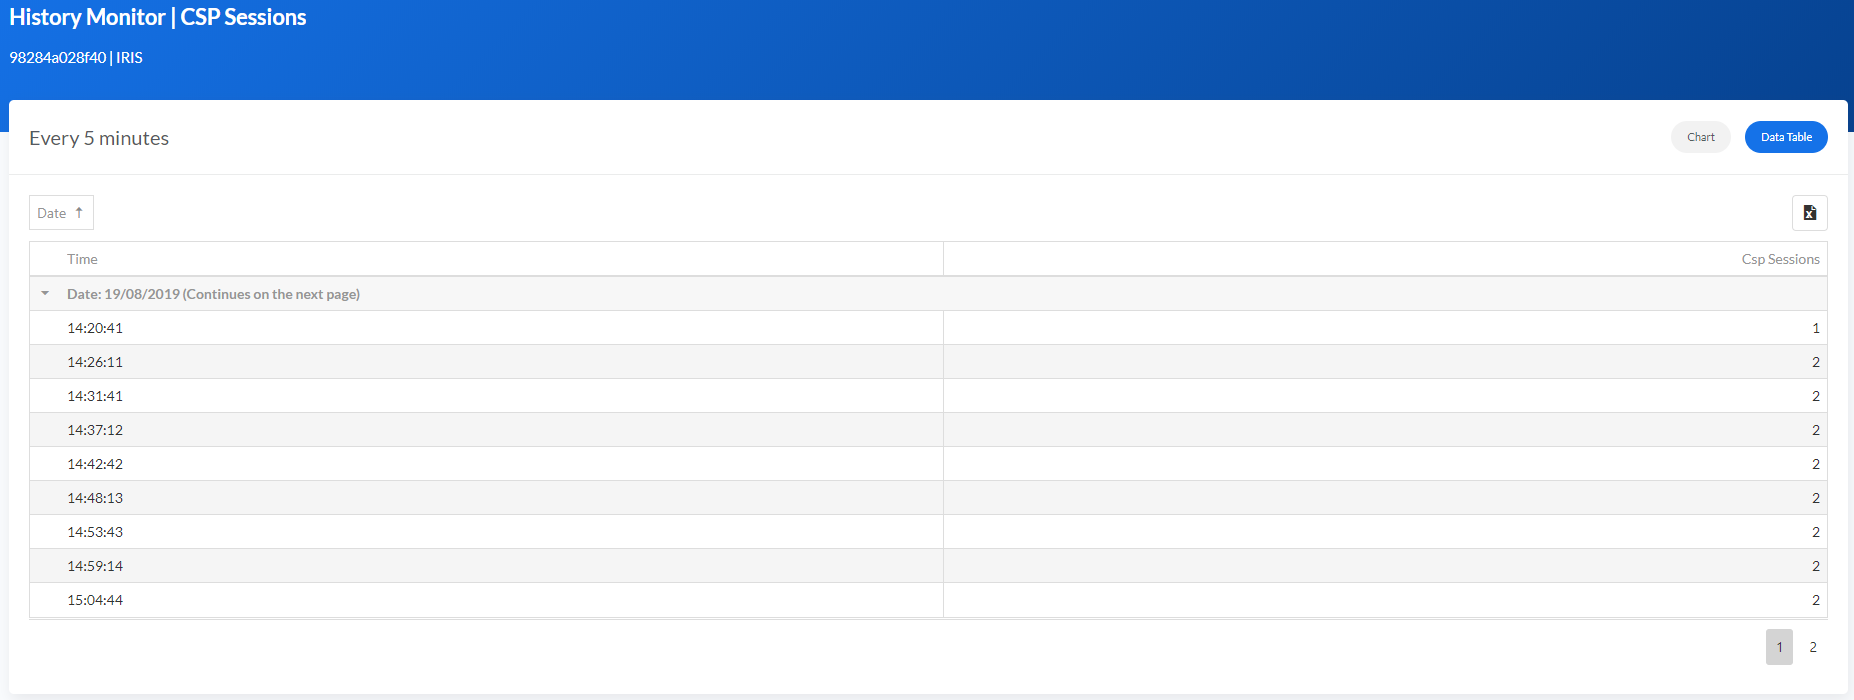
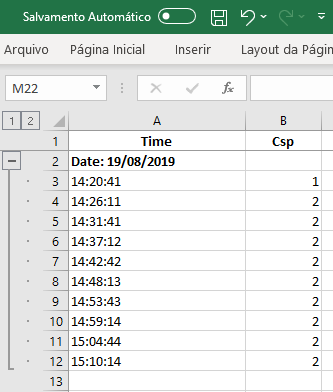
The excel shows the same format, content, and group defined in the CSP.
Zooming
All charts have the Zoom option to visualize the information with more details.
Average and Maximum
For the Sections Hourly and Daily, the charts show Average and Maximum values.
AVG
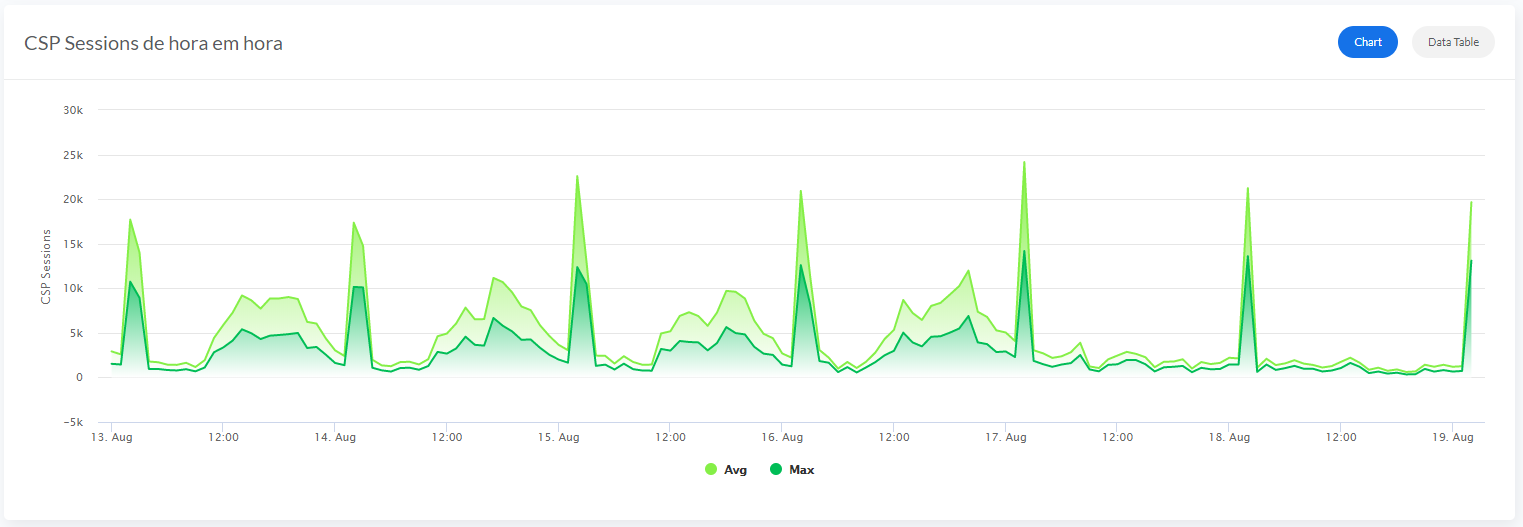
Max
Enjoy!
Comments
Wow, @Henrique.GonçalvesDias! This is fantastic!
Thanks, @Evgeny Shvarov !
The community feedback it's very important, hoping to help and have opportunities to improve this project
Works like a charm!
.png)
This looks really good!
Any idea how I'd be able to use this in a non-docker environment?
@Julian Matthews the original project was in a non-docker environment.
But my suggestion is to put the folder Csp in the same path that you choose in: <Default Name="APPPATH" Dir="/opt/app/" />
Change the /opt/app/ to whatever directory you want.
Next, you can use the class Installer.cls to create the Database, Namespace, and Web Application.
So, run the following lines of the Dockerfile in the Caché Terminal:
Do $system.OBJ.Load("/opt/app/Installer.cls","ck")
Set sc = ##class(App.Installer).setup(,3)
Or you can also go totally Old School and create everything manually and import all classes and CSP files ![]()
Let me know if you want a Studio Project in an XML format. So you can import CLS and CSP files easily using the Studio.
I did consider going the oldschool route, but your guidance above worked perfectly for me ![]()
That's great!
Can I impose on you do do that for me so I can try old school?
I'm sorry Gary, but since 2020, I don't have Studio anymore.
But you can download the whole project, unzip, open a Caché/IRIS terminal, go to your preferred namespace and import all the files with the following command:
Do $system.OBJ.Load("/tmp/iris-history-monitor/src","ck")
How do I find the project?
I looked all over
Hi Henrique!
Have a question: do you really need to install MSGViewer to a separate namespace?
I mean - do you really need two namespaces to work with your monitoring?
Discussing the system monitoring with @Renan Lourenco He gave me the idea for a new Message Viewer.
So I decided to try in a different Namespace using Interoperability to use Manifest features a little more :)
Should I make it simpler to avoid people getting confused?
Everything is perfect with your solution!
I was going to publish it on Package Manager which installs packages only in one namespace - the namespace where you call:
zpm:NAMESPACE>install package-name
Henrique, well done ! Our community can only grow from strength to strength with contributions like this. Thank you very much.
@Andre Wessels thank you very much.
Hi @Henrique.GonçalvesDias!
JFYI we have a new API in 2019.4 for IRIS monitoring. Is it possible to introduce its data into your module?
Hi @Evgeny Shvarov
Thanks for the news about the new API
I'm more than happy to create something using the new API.
Hi,
Do we have to buy DevExtreme licence and download their executable for it?
Hi Neerav,
It's free for developing Non-commercial applications
Hi Henrique.
This is very nice. I started using this at work and I was wondering if it would be too complicated to add a Mirror Monitor Widget to the CSP page.
Could you give me any clues?
Kind Regards.
P.S.: Obrigado.
Hi @Joao Palma
To add new widget to the dashboard page, edit the dashboard.csp
The CSP page use bootstrap, javascript, and just a few tags of <script language="Cache" runat="server">
To retrieve the information, the ClassMethod ##(VAR.infra.dashboard.dashboard). getMetrics() is called by the javascript function:
function getSamples() {
  $.getJSON(urlPreparacao, {
  method: "getMetrics"
}
The ClassMethod give to you the following properties:
- "ApplicationErrors": 1,
- "CSPSessions": 1,
- "CacheEfficiency": "140.55",
- "DatabaseSpace": "Normal",
- "DiskReads": 4747741,
- "DiskWrites": "40290",
- "ECPAppServer": "OK",
- "ECPAppSrvRate": "0",
- "ECPDataServer": "OK",
- "ECPDataSrvRate": "0",
- "GloRefs": 672977994,
- "GloRefsPerSec": "15740.00",
- "GloSets": 2575733,
- "JournalEntries": 480333,
- "JournalSpace": "Normal",
- "JournalStatus": "Normal",
- "LastBackup": "",
- "LicenseCurrent": 3,
- "LicenseCurrentPct": "2",
- "LicenseHigh": 4,
- "LicenseHighPct": "3",
- "LicenseLimit": 150,
- "LicenseType": "Ensemble 2012.2 Enterprise, Multi-Server, Platform Independent, Development License, Web Add-On, DeepSee Analyzer, DeepSee Mode",
- "LockTable": "Normal",
- "LogicalReads": 472186661,
- "Processes": "12",
- "RouRefs": 247229866,
- "SeriousAlerts": 0,
- "ShadowServer": "OK",
- "ShadowSource": "OK",
- "SystemUpTime": "0d 4h 31m",
- "WriteDaemon": "Normal"
In case none of the properties helps you, create a new ClassMethod with the information that you want and modify the dashboard.csp
Adding a new javascript function, it will retrieve the information that fits your needs.
I hope that helps.
Best Regards,
Henrique
Thank you, Henrique.
I've had a look at it yesterday. The whole project is very well structured.
Well done again for it.
I'm creating another page rather than adding in more stuff to the dashboard as I don't want to fill it more.
Then using a new classmethod and javascript as you've said I'm going to get the properties out of %SYSTEM.Mirror I think.
That is the bit I am not completely sure about. But I will eventually get there.
Kind Regards,
Joao Palma
In case someone would like to add the Mirror Monitor to the app I managed to do it using the following:
s rs = ##class(%ResultSet).%New()
s rs.ClassName="SYS.Mirror"
s rs.QueryName = "MemberStatusList"
d rs.Execute("MIRRORNAME")
s arrayMessage = []
While rs.%Next() {
s obj = {}
DO obj.%Set("MirrorMemberName", rs.GetData(1))
DO obj.%Set("CurrentRole", rs.GetData(2))
DO obj.%Set("CurrentStatus", rs.GetData(3))
Do arrayMessage.%Push(obj)
}
Parabéns Henrique, seu projeto é muito interessante e útil para monitoramento dos ambientes.