Hi Community,

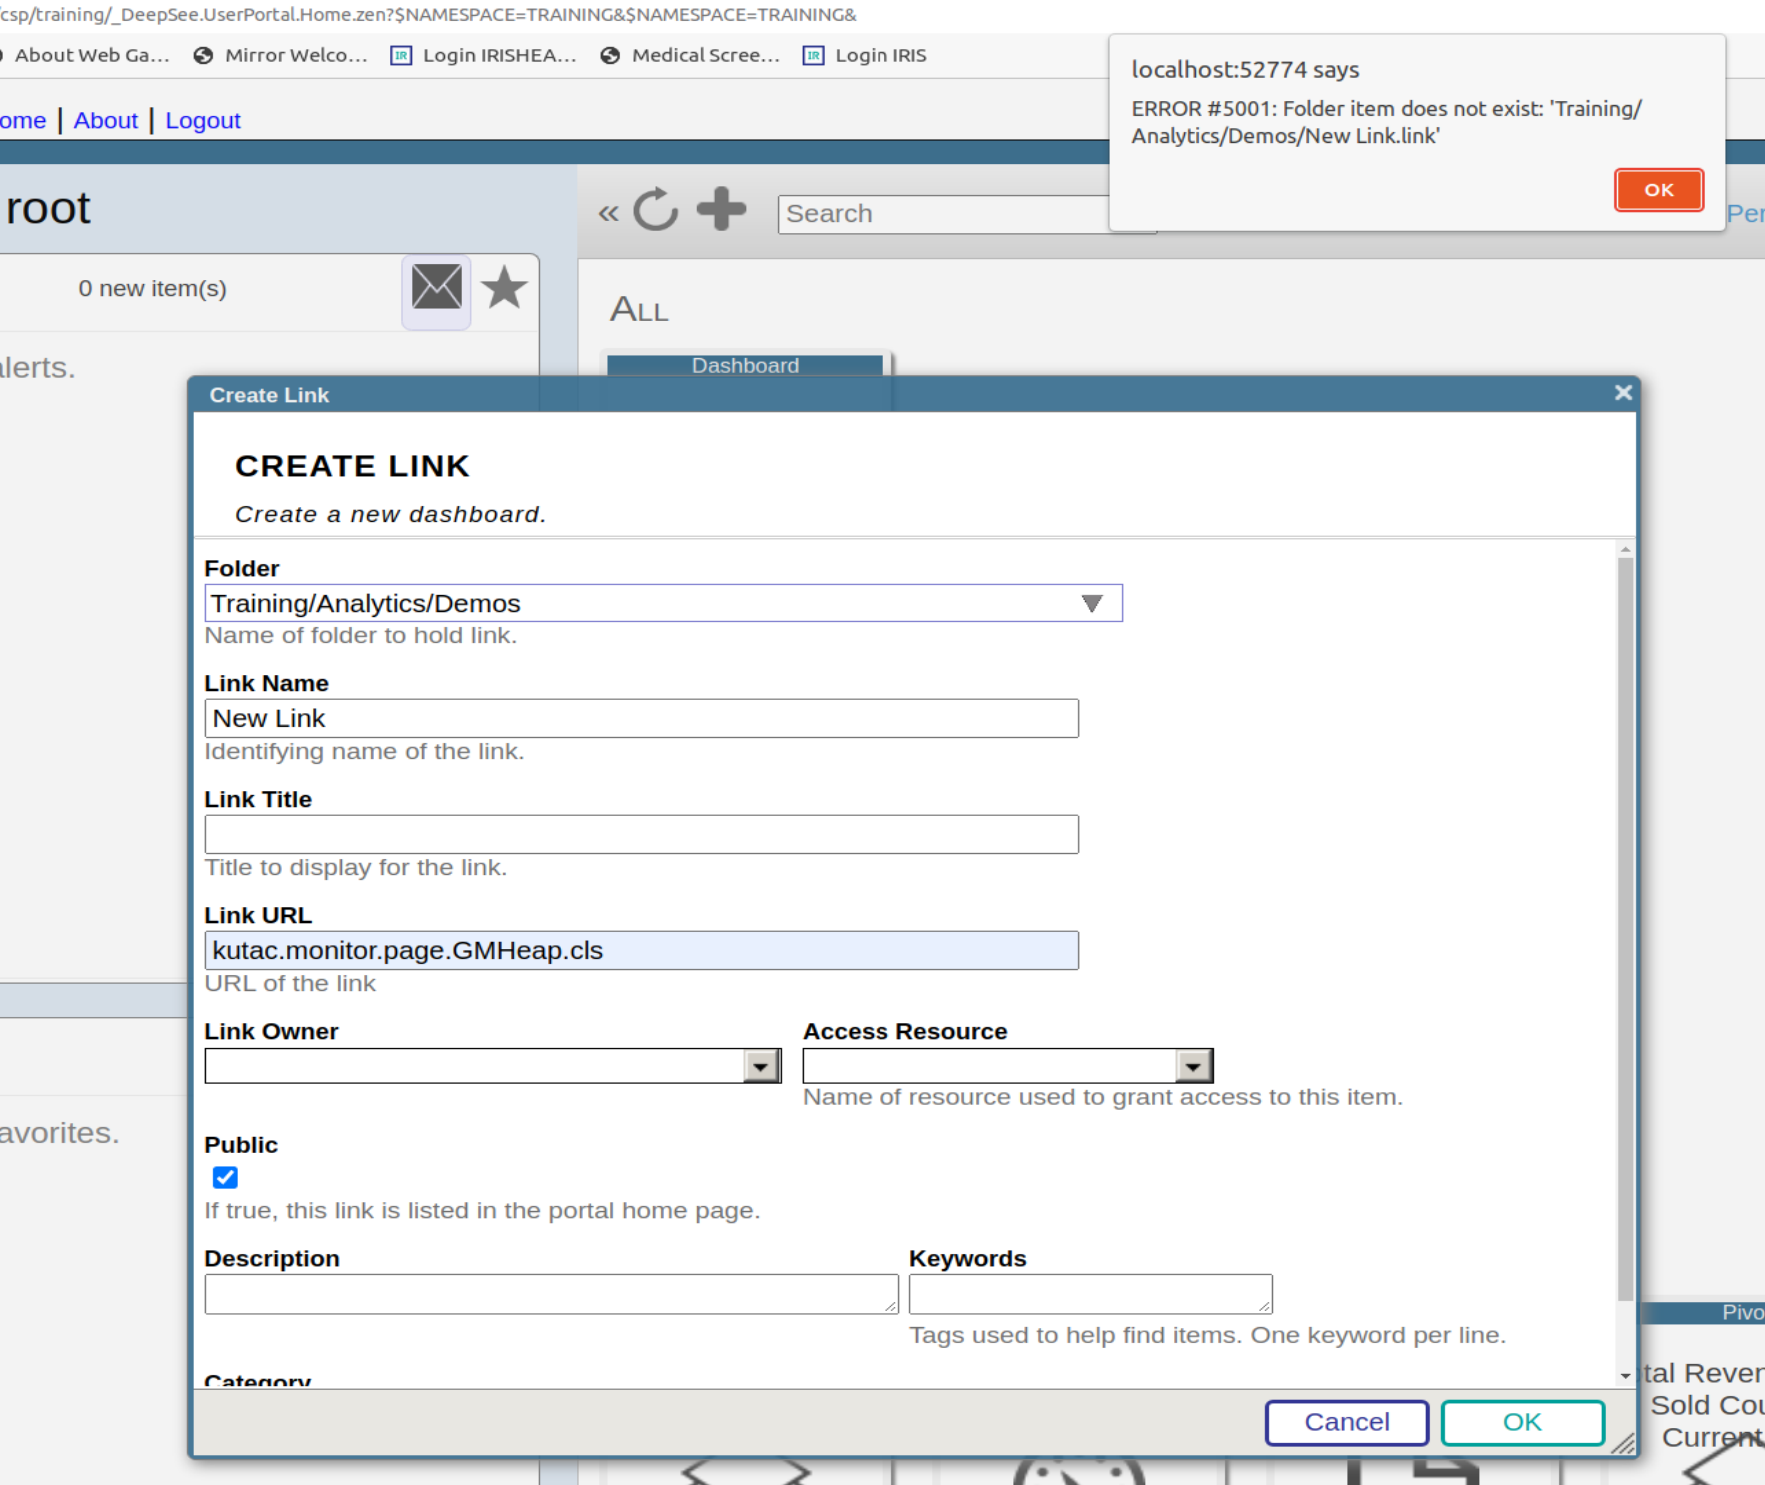
I am using a method taht calls a Dashboard in Deepsee web from an application , but I want to know if it's possible to not showing the header, this part that have the search button, the name of the namespace, etc..

This is the method :

Method %OnAfterCreatePage() As %Status
{
//Set contratistaId = $Get(%session.Data("ContratistaId"),"")
//Set gerenciaId = $Get(%session.Data("GerenciaId"),"")

1 10
0 508

Hello,

I work on a dashboard. I understand basic html. I like to draw two boxes in different colors on the background. There will be multiple small boxes inside or over the boxes in the background. I defined the large boxes as <div> and the smaller boxes also as <div> inside the larger <div>. So far so good.

How can I draw lines with arrows between the smaller boxes?

0 9
0 313
Question
· Aug 13, 2019
Dashboard - Line Graph

Hello,

I want to create a dashboard with a line graph that shows system availability over time. I used this code to create a Dashboard:

            Set tItem = ##class(%DeepSee.UserLibrary.Link).%New()
                Set tItem.fullName = "Availability"
                Set tPage = "Availability.UI.CSVImport.zen"
                Set tItem.href = $system.CSP.GetPortalApp($namespace,tPage)_tPage
                Set tItem.title = "Availability"
                Set tSC = tItem.%Save()
0 7
0 289

I built a dashboard to show hourly instrument capacities based on a term list. The term list consists of the TestInstrumentID and the number of tests that instrument can perform in 1 hour. The calculation works correctly and the data is accurate but periodically if you go to check the dashboard the percentages all get changed to 100% across every hour. If you check it later or add an additional site to the filter then the percentages correct themselves. I don't know what's causing this or how to troubleshoot it because it does calculate correctly but is not consistent.

0 6
0 186

Hello, has anyone tried to use Caché as a reverse proxy ?

We are trying to embed a dashboard server (Plotly Dash in this case, but it could be anything which runs on its application server) inside our application which is written in Caché.
The dashboard/report server runs locally (for example, or inside a LAN) on port 8080, and has no authentication features, so we have to implement them on a different layer, and we'd like to use Caché for it.

1 5
0 452

Hi -

I need an example of what I need to "map" to have a common dashboard defined so it will visible/usable in multiple namespaces.

I have created a dashboard in "SAMPLES" (namespace and database) and I would like to have this dashboard be accessable/useable from a 2nd namespace, but I'm not having any success in doing mappings (global/package/routine/data) to be able to get DeepSee to be able to see/display the dashboard.

What is the minimum that I need to map?

0 4
0 361
Question
· Nov 23, 2016
DeepSee: Filtering a filter

When creating a filter located on a dashboard that targets all, is there a way to narrow that filter down?

For example, in our data we have some dates that are well out of range due to data quality issues, but they still appear in the drop downs. Is there a way to say, only make available the below dates in the filter?

Another example, If we want to only look at Emergency data, it still provides all the wards for inpatient activity and activity in other hospitals, meaning, to get to just the Emergency wards you have to scroll through everything?

Hope that makes sense.

0 4
0 434

Hello, I've completed this tutorial: https://community.intersystems.com/post/deepsee-period-date-vs-same-peri...
I've used the "year" level instead of a pivot variable.
I want to calculate something like the following variation: 100 * ([DateOfSale].[PTD] - [DateOfSale].[LYPTD]) / [DateOfSale].[LYPTD]
I create a new calculated member, under the same dimmension with the above expression.

0 3
0 364

Hi, folks!

When you deploy DeepSee solutions you often do not want grant a User %All Role to work with a particular Dashboard.

Consider a Dashboard 'Dash' with a few widgets where listings are being used.

If you manage a Role to get access to the Dash you need to grant access to %DB_DBNAME resource to have a database access, grant access to a Dashboard resource (if any) and ... grant SELECT accesses to all the tables involved in SQL queries being used in all the listings of widgets.

1 3
0 417
Question
· Apr 26, 2023
Custom Dashboard

I am wondering if anyone has created a custom dashboard that can be accessed outside of the Ensemble environment. What I am looking to do is create a dashboard accessible from a person's computer, on the same company network as Ensemble, that can display information regarding specific services, operations, processes, queues, etc. I don't want to give a user access to Ensemble, just allow them to display a page in their browser to give them the information they need to make sure their processes are running.

0 3
1 194

After creating a new dashboard the filters and favorites are not displaying on the left side.

The version info is as follows:

Cache for Windows (x86-64) 2017.2.1 (Build 801_3_18358U) Tue Jul 24 2018 16:38:29 EDT [HealthShare Modules:Core:15.032.8680 + Linkage Engine:15.032.8680 + Clinical Viewer:15.032.8680 + Active Analytics:15.032.8680

Thanks,

LG

0 3
0 150
Question
· Jun 2, 2016
Filtering a Filter

What would be the easiest or best way to filter the options presented by a filter control?

For example, suppose that I create a query using HoleFoods that uses a named filter to filter the product categories according to some criteria. When I display the query on the dashboard, I would like to provide a filter control that will allow users to further constrain the product categories. However, a simple filter control will display all the product categories available in the cube many of which are irrelevant to the current query.

Thanks for your help!

0 3
0 352

Hi,
I cannot edit properties (title etc) of Widgets within Dashboards outside of the ENSDEMO namespace:
I have a namespace "HL7Report" for example;
I have some Pivots created looking into a cube's data;
I click "DeepSee", "User Portal" from the Management Portal;
I click "+", "Add Dashboard", folder/name/title/category all as "new", "OK", new dashboard appears;
I click ">", "Widgets >", "+", and select a pivot to display as a table (chart / anything);

0 3
0 315
Question
· Jul 24, 2020
Uptime reports for Ensemble HL7

Good morning all,

Could we please get some insight on what is possible (or what other organizations may be using) for tracking uptime for our HL7 engine? We can use Activity Tracking to show how many messages went through, but are there any good canned reports (or queries) about the number of message failures or the amount of time that an interface was down?

We are using alerting to the team to know about not getting messages or if messages failed. Has anyone created a report or dashboard against the Ens.Alert table or would you recommend elsewhere?

0 3
0 230

I would like to define an advanced filter within my pivot table that allows me to look at diagnosis codes, or at procedure codes - but I do not want to hard code values within the pivot table definition (get the %OR defined).

I would like to be able to allow my dashboard user to chose what specific diagnosis codes or procedure codes they are interested in. So for example one user may want to look for # of patients with cancer dx or patients who have had a radiation procedure.

How can I accomplish this OR feature using dashboard filters?

0 2
0 381