This tag relates to the discussions on the development of analytics and business intelligence solutions, visualization, KPI and other business metrics management.
The release of InterSystems IRIS 2021.1 introduces Adaptive Analytics. To get started with a familiar InterSystems IRIS BI sample cube, we have created a HoleFoods Sample Application for Adaptive Analytics. This Sample Application is available on Open Exchange. There is also a learning services course available to learn more about Adaptive Analytics.
At this year’s Global Summit, InterSystems debuted InterSystems IRIS Data Platform™, a single, comprehensive product that provides capabilities spanning data management, interoperability, transaction processing, and analytics. InterSystems IRIS sets a new level of performance for the rapid development and deployment of data-rich and mission-critical applications. Now is your chance to learn more!
Following up the previous part, it's time to take advantages for IntegratedML VALIDATION MODEL statement, to provide information in order to monitor your ML models. You can watch it in action here
https://www.youtube.com/embed/l89QxOytjEk [This is an embedded link, but you cannot view embedded content directly on the site because you have declined the cookies necessary to access it. To view embedded content, you would need to accept all cookies in your Cookies Settings]
Today we will talk about InterSystems Reports. This is a BI system that provides you with tools to create static reports and export them to different file formats. We will see how it works using the DC Analytics public analytical sample as an example. In this article, we will examine how to familiarize yourself with the reports available in the repository, how to make a new report based on a ready-made data structure, and how to prepare a data structure from scratch.
A simple data analysis example created in IntegratedML and Dashboard
Based on InterSystems' Integrated ML technology and Dashboard, automatically generate relevant predictions and BI pages based on uploaded CSV files. The front and back ends are completed in Vue and Iris, allowing users to generate their desired data prediction and analysis pages with simple operations and make decisions based on them.
In our latest episode of Data Points, I had a conversation with @Thomas Dyarabout AI Link, which helps bridge the gap between data scientists and business analysts. Our conversation talks about how AI Link fits with IntegratedML and Adaptive Analytics, as well, as what new features are on the horizon for IntegratedML. Take a listen!
https://5e18edf067eb59-03854285.castos.com/player/1346398 [This is an embedded link, but you cannot view embedded content directly on the site because you have declined the cookies necessary to access it. To view embedded content, you would need to accept all cookies in your Cookies Settings]
When we collect temporary data (the number of purchases in the store, the number of comments on the post), it may happen that there is no data for a certain period of time. In this case, this time period (hour, day, month) is not represented in the database, that is, there is not a single row for this period. In other words, there are no rows in the database for this period.
There are several options how to deliver user interface(UI) for DeepSee BI solutions. The most common approaches are:
use native DeepSee Dashboards, get web UI in Zen and deliver it in your web apps.
use DeepSee REST API, get and build your own UI widgets and dashboards.
The 1st approach is good because of the possibility to build BI dashboards without coding relatively fast, but you are limited with preset widgets library which is expandable but with a lot of development efforts.
The 2nd provides you the way to use any comprehensive js framework (D3, Highcharts, etc) to visualize your DeepSee data, but you need to code widgets and dashboards on your own.
Today I want to tell you about yet another approach which combines both listed above and provides Angular based web UI for DeepSee Dashboards - DeepSee Web library.
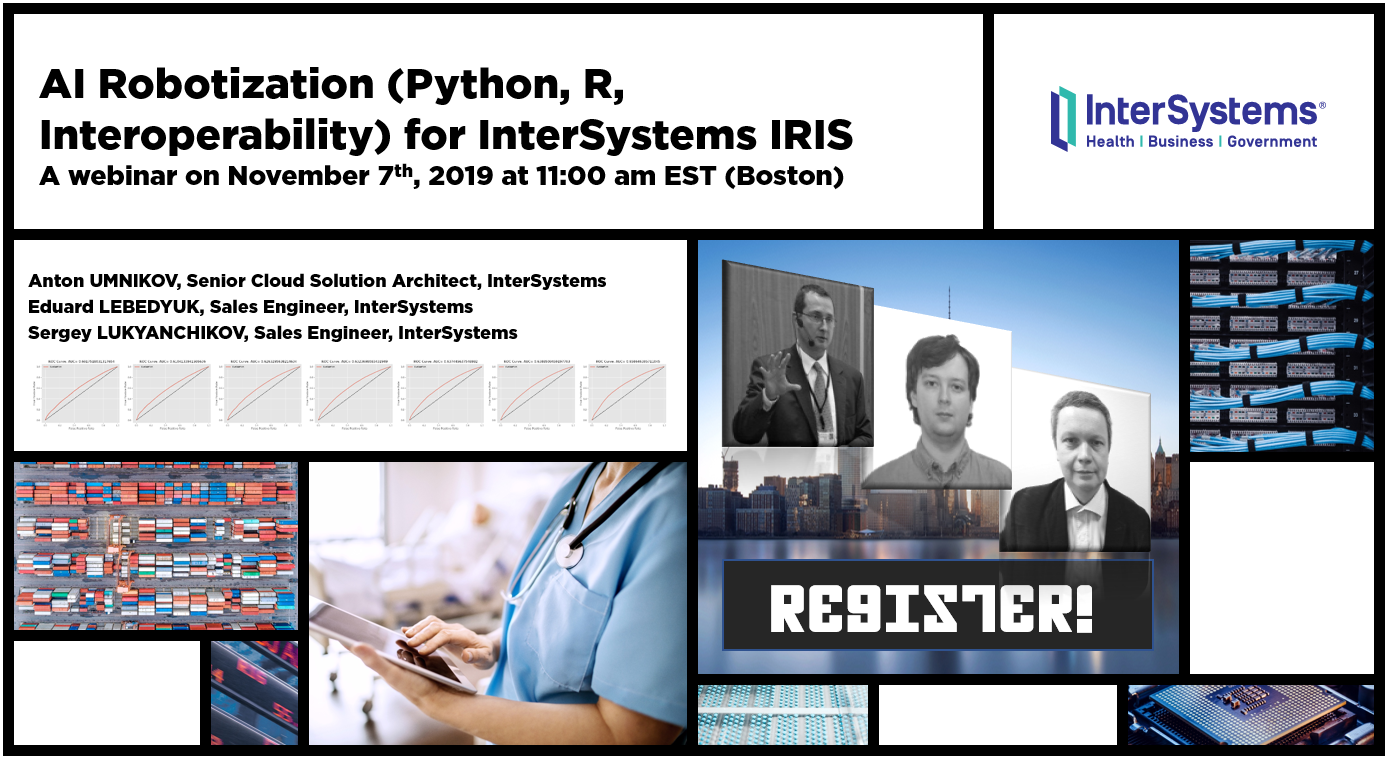
Do you want to reap the benefits of the advances in the fields of artificial intelligence and machine learning? With InterSystems IRIS and the Machine Learning (ML) Toolkit it’s easier than ever.
Join InterSystems Sales Engineers, @Sergey Lukyanchikovand @Eduard Lebedyuk, for the Machine Learning Toolkit for InterSystems IRIS webinar on Tuesday, April 23rd at 11 a.m. EDT to find out how InterSystems IRIS can be used as both a standalone development platform and an orchestration tool for predictive modelling that helps stitch together Python and other external tools.
Fast transfer. Pass globals, classes and tables from InterSystems IRIS to Python with ease and speed (10x faster than old QueryExecute). Documentation.
https://www.youtube.com/embed/-AdK9sOwk50 [This is an embedded link, but you cannot view embedded content directly on the site because you have declined the cookies necessary to access it. To view embedded content, you would need to accept all cookies in your Cookies Settings]
TL;DR: My comment to Microsoft when I voted:Our team has implemented most of what we need for source management of Power BI Report files in Perforce. The missing piece?
With the release of InterSystems IRIS, we're also making available a nifty bit of software that allows you to get the best out of your InterSystems IRIS cluster when working with Apache Spark for data processing, machine learning and other data-heavy fun. Let's take a closer look at how we're making your life as a Data Scientist easier, as you're probably already facing tough big data challenges already, just from the influx of job offers in your inbox!
I recently discovered the Monitoring Activity Volume feature in IRIS and I was amazed by it. So, I put it to work in one of our productions. It is nice how easy it is to set up and all the possibilites that came with it.
But there's something weird: the numbers. Actually, one of the BP is stating a time of more than 6 seconds to process:
By design, DSW provides an implementation for every widget in DeepSee library. But there are some extra features in DSW which make solutions built with DSW dashboards more functional. This article describes it.
https://www.youtube.com/embed/z9O0F1ovBUY [This is an embedded link, but you cannot view embedded content directly on the site because you have declined the cookies necessary to access it. To view embedded content, you would need to accept all cookies in your Cookies Settings]
InterSystems Developer Community analytics. Project made with InterSystems IRIS BI (DeepSee), Power BI and Logi Report Designer to visualize and analyze members, articles, questions, answers, views and other pieces of content and activity on InterSystems Developer Community.
You can see your own activity, articles and questions. Track how your contribution changes developer community.
When analyzing data, there is often a need to look at specific indicators more thoroughly and to highlight sections of information of particular interest to a user.
For instance, examining the data dynamics for specific regions or dates can help us uncover some hidden trends and patterns that will allow us to make an informed decision about our project in the future.
In the previous part of this series, we saw how to include data in a portlet from within DeepSee. This used the built in data controller. In this part, we are going to be pulling in data from outside of DeepSee. This will include both information from within InterSystems IRIS and from the OS.
Why use this?
This is useful if you would like to create a dashboard that only contains information about your system. It is also useful if you want to display data about your system along side data that you have stored in DeepSee.
 By likes
.png)
 Open Exchange app
.png)
.png)


.png)
.png)