How to develop in Logi
Today we will talk about InterSystems Reports. This is a BI system that provides you with tools to create static reports and export them to different file formats. We will see how it works using the DC Analytics public analytical sample as an example. In this article, we will examine how to familiarize yourself with the reports available in the repository, how to make a new report based on a ready-made data structure, and how to prepare a data structure from scratch.
To begin with, you need a licensed copy of InterSystems Reports.
You can obtain your copy of Logi Designer or Logi Server from WRC:
Linux (https://wrc.intersystems.com/wrc/WRC.StreamServer.cls?FILE=/wrc/Live/GeneralKits/IRIS/iscreports_designer-19.0.0.4-linux.bin),
Windows (https://wrc.intersystems.com/wrc/WRC .StreamServer.cls?FILE=/wrc/Live/GeneralKits/IRIS/iscreports_designer-19.0.0.4-windows.exe)
To get access to the WRC, your company should be a client of InterSystems Corporation.
Also, you will need drivers for providing InterSystems Reports JDBC connections to data sources. You can find them here: https://github.com/teccod/Logi-JDBC-drivers. To use those drivers, you can place the lib folder in the root folder of Logi Report Designer's installation directory.

Report files on InterSystems Reports are located in the repository below: https://github.com/intersystems-community/dc-analytics/tree/master/analytic_dashboards/logi%20report
There are 2 folders here. One of them contains a report about activities in the English-speaking community in DC (folder ‘En report’). The second one includes a statement about distribution of English-speaking users across other language communities (folder ‘members by community’).
Each folder retains 4 files. The .pdf file encloses an example of a report generated in InterSystems Reports. The .cat files holds the data structure and all the necessary settings for connecting to Adaptive Analytics. The file with the ‘localhost’ attribute is configured to connect to the Adaptive Analytics instance in Docker container. It deploys from the repository. In the file with the ‘public_demo’ attribute, the connection to Adaptive Analytics deployed on the demo server is configured. The .cls file incorporates all the visual elements of the report.
InterSystems Reports is organized in such a way that allows you to open a data structure file first, and then go to any other file with visualizations in the same folder. In this case, if the visualizations are configured for a different data structure, you will receive an error message. This structure gives you an advantage in two situations. The first one is that you can have multiple data sources with the same structure that lets you develop only one report file and simply open it from different .cat files to generate all other reports. The second one is that you can develop multiple reports for one data source, where all queries and formulas that you have created for one report will be immediately available to you in others.
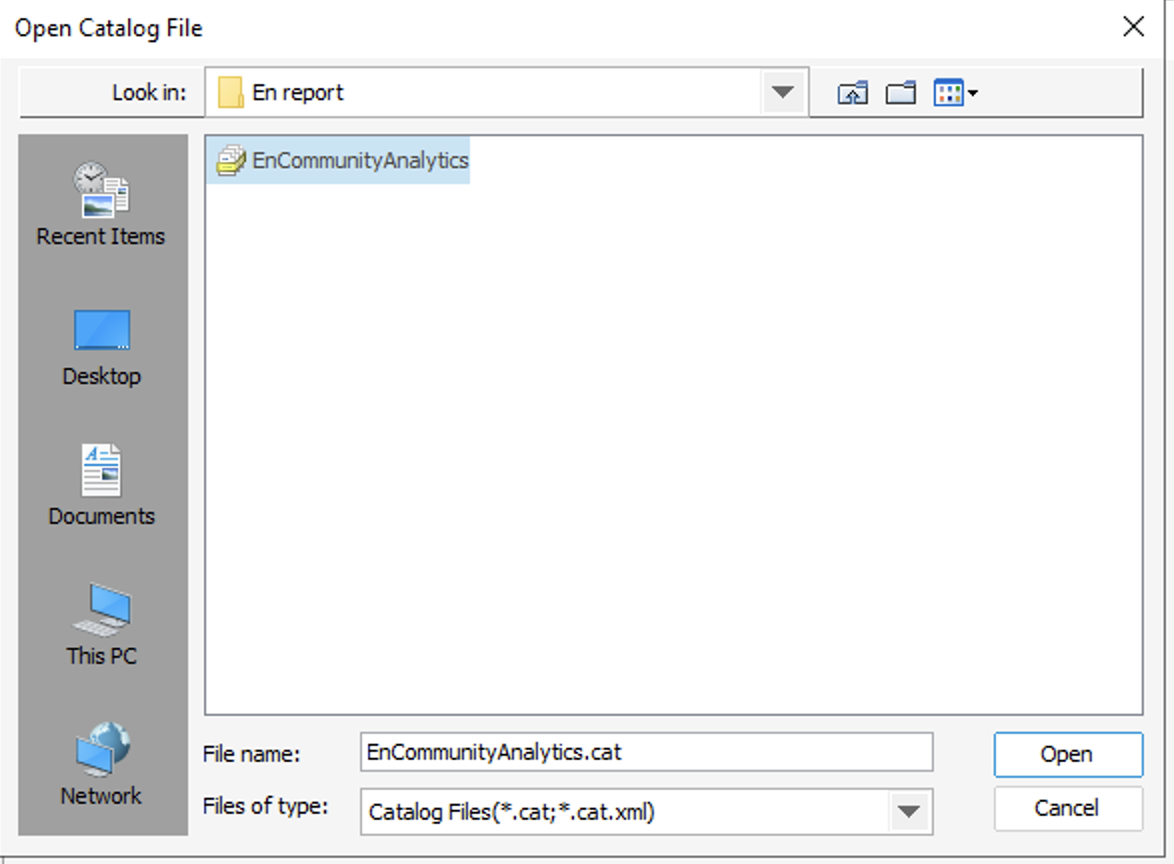
To view the contents of the report, you need to launch InterSystems Reports, click the “Browse” button on the start page. Then use the “Browse…” button in the “Open Report” dialog box to select the path to the .cat file of the report.
In the Reports tab, you will be offered a .cls file of visualizations. All .cal files that are in the same directory as the .cat file are available in this tab.

After opening the .cls file, you will find yourself in the report editing interface. In order to fill in the report with data and see its output, you need to switch from the Design tab to the View tab in the central window.

After that, InterSystems Reports will start sending queries to the data source and generating a report. The report will be generated page by page as soon as the data is ready.
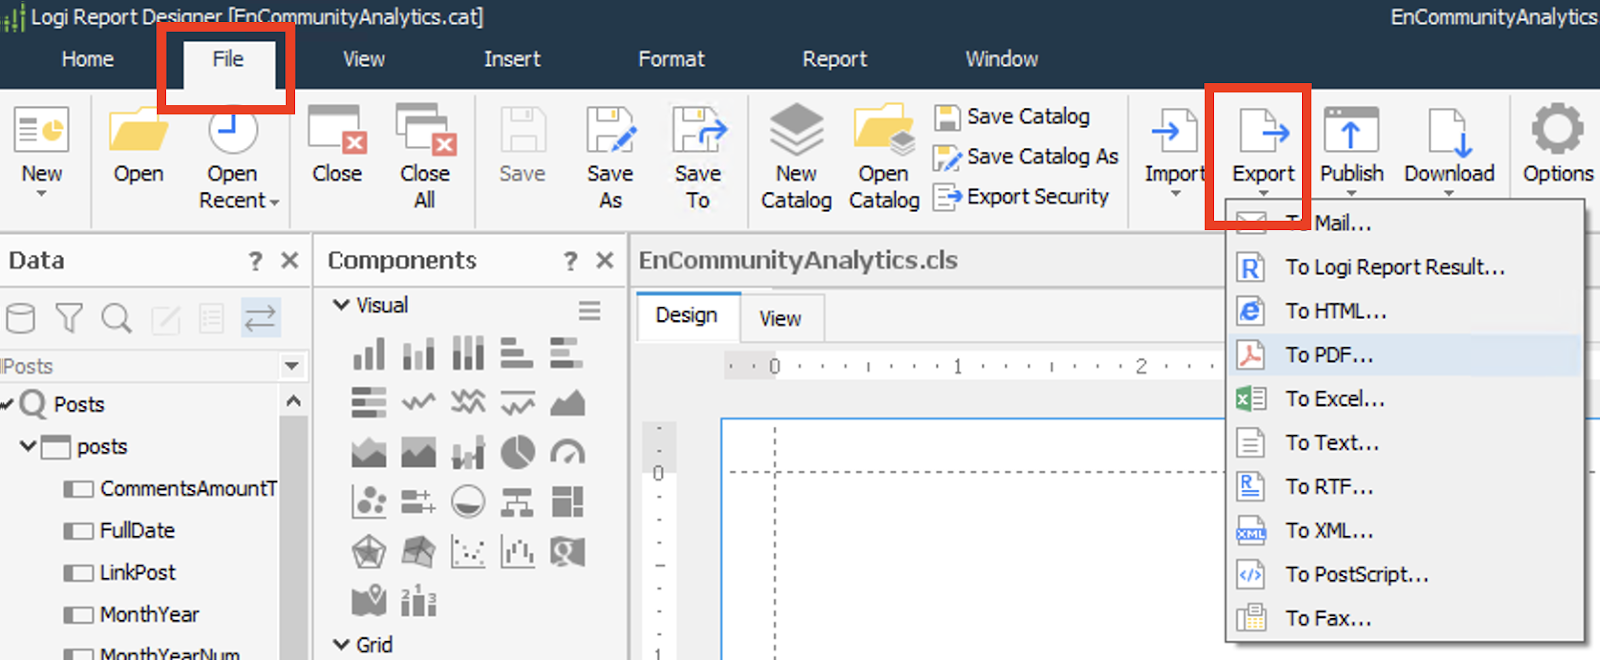
After selecting the format, you will be prompted to a window with export settings. After configuring, the file will be immediately generated on your disk. If you do this procedure from the Design tab, then before generating a report, InterSystems Reports will first request all the necessary data, and only then export the report to a file. At this time, the editing interface “freezes” so you will be able to understand that the file formation is completed when you again get an option to do something in the Design tab (for example, scroll the report layout in it).
If you want to create a report yourself based on public analytics data, you will need to know the structure of data transfer from the source to the widget in the report. The first step is to establish a JDBC connection to Adaptive Analytics. To do this, we should specify the connection settings: a link from the Adaptive Analytics interface, login and password for access to the Adaptive Analytics instance. This will establish a connection to one of the projects in Adaptive Analytics. You can find out what a project is and where to get a link to connect to it in a separate article about Adaptive Analytics.

Once the connection is set up, we can add cubes from Adaptive Analytics to the .cat file, that will look like a table with a set of columns.
Based on those tables, we can build queries where we can select only the required columns and apply filters to the data.

Inside queries, we can build additional calculated columns, write formulas for data transformation, and do aggregations on data.
Formulas and aggregations done in one query will be available in all other queries based on the same table and containing fields used in formulas and aggregations.
Any widget is based on one of the queries. In this case, InterSystems Reports will create a separate query with a unique name for each widget. You can manually change such queries for each widget or create new ones. When copying a widget, the copy will hang on the same query as the original. Sometimes this leads to problems when creating reports. This is why you should be aware of this.

In summary, there are 2 levels of queries. The first one is created in the .cat file and is responsible for columns and filters that will be used in the query. The second one is assembled in the .cls file and is a copy of the first type query. When generating a report, InterSystems Reports sequentially executes queries of the second type and passes data to the widgets associated with those queries.
When building a widget in a report, fields from a query and formulas behave in the same way - like a data field. Aggregations are usually done based on two fields. For that reason, when you add an aggregation to the same line chart, it will immediately take both: the x-axis and the y-axis.

Once you know how InterSystems Reports works, it will be easier for you to figure out how specific data visualizations are built. You can find all necessary information in the documentation and guide for beginners, which are prepared by the developers of InterSystems Reports.
You can find tutorials for beginners following this link:
https://devnet.logianalytics.com/hc/en-us/articles/4405661266455-Track-1-Creating-Page-Reports
Documentation for the latest version is stored at this link:
https: //devnet.logianalytics.com/hc/en-us/sections/5735298972439-Logi-Report-Designer-v19
There is also an old version of the documentation site, which I find more convenient (probably because I'm used to it). This link only has documentation up to version v18:
https://documentation.logianalytics.com/rsg/content/html/install/issue.htm
In order to save the changes you made in the report, you need to save both files: .cat and .cls. The .cls file is saved on the File tab of the top menu. This tab has a section with a “Save” button. The .cat file is saved on the Home tab. When you click on the “Catalog Manager'' button, a catalog editing window will pop up. In this window, there is a “Save Catalog” button. If you decide to exit the program without saving the changes, you will also get 2 dialogue boxes asking if you want to save the changes in the .cat and .cls file.
For Git, .cat and .cls files are binary. However, all of us know that the .cls extension is also reserved for IRIS classes. Hence, we recommend saving the files for Intersystems Reports in a separate folder in the repository. Remember to change the settings in the .gitattributes file according to the fact that all files in the folder are binary.

You can find an example of such implementation in the .gitattributes file in the DC-analytics repository.