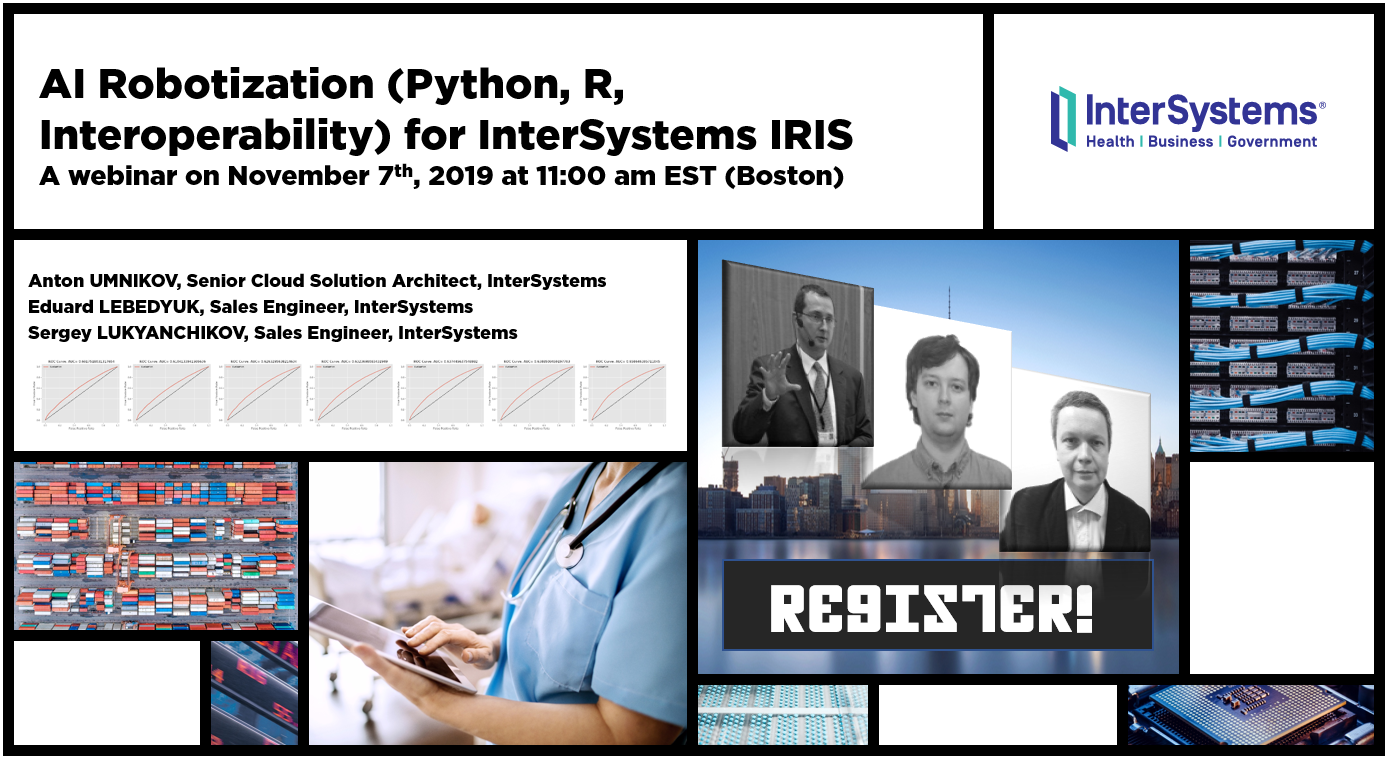
Hi Community,

We are pleased to invite all the developers to the upcoming InterSystems Analytics Contest Kick-off Webinar! The topic of this webinar is dedicated to the Analytics contest.

On this webinar, we’ll demo AtScale, InterSystems Reports (Logi), IRIS BI, IRIS NLP and answer the questions on how to develop, build, and deploy Analytics applications using InterSystems IRIS.

Date & Time: Monday, August 23 — 10:00 AM EDT

Speakers:
🗣 @Carmen Logue, InterSystems Product Manager - Analytics and AI
🗣 @Evgeny Shvarov, InterSystems Developer Ecosystem Manager

3 6
0 281
Article
· Aug 13, 2021 4m read
Building Analytics Solution with IRIS

Hi developers!

How to build an analytics solution with InterSystems IRIS?

To begin with, let's agree on the points of what is the analytics solution - and this could be a very wide topic. Let's limit the set of solutions to those you can present in the Analytics contest.

There are three kinds of analytics solutions that we will review here: monitoring, interactive analytics, and reporting.

Monitoring

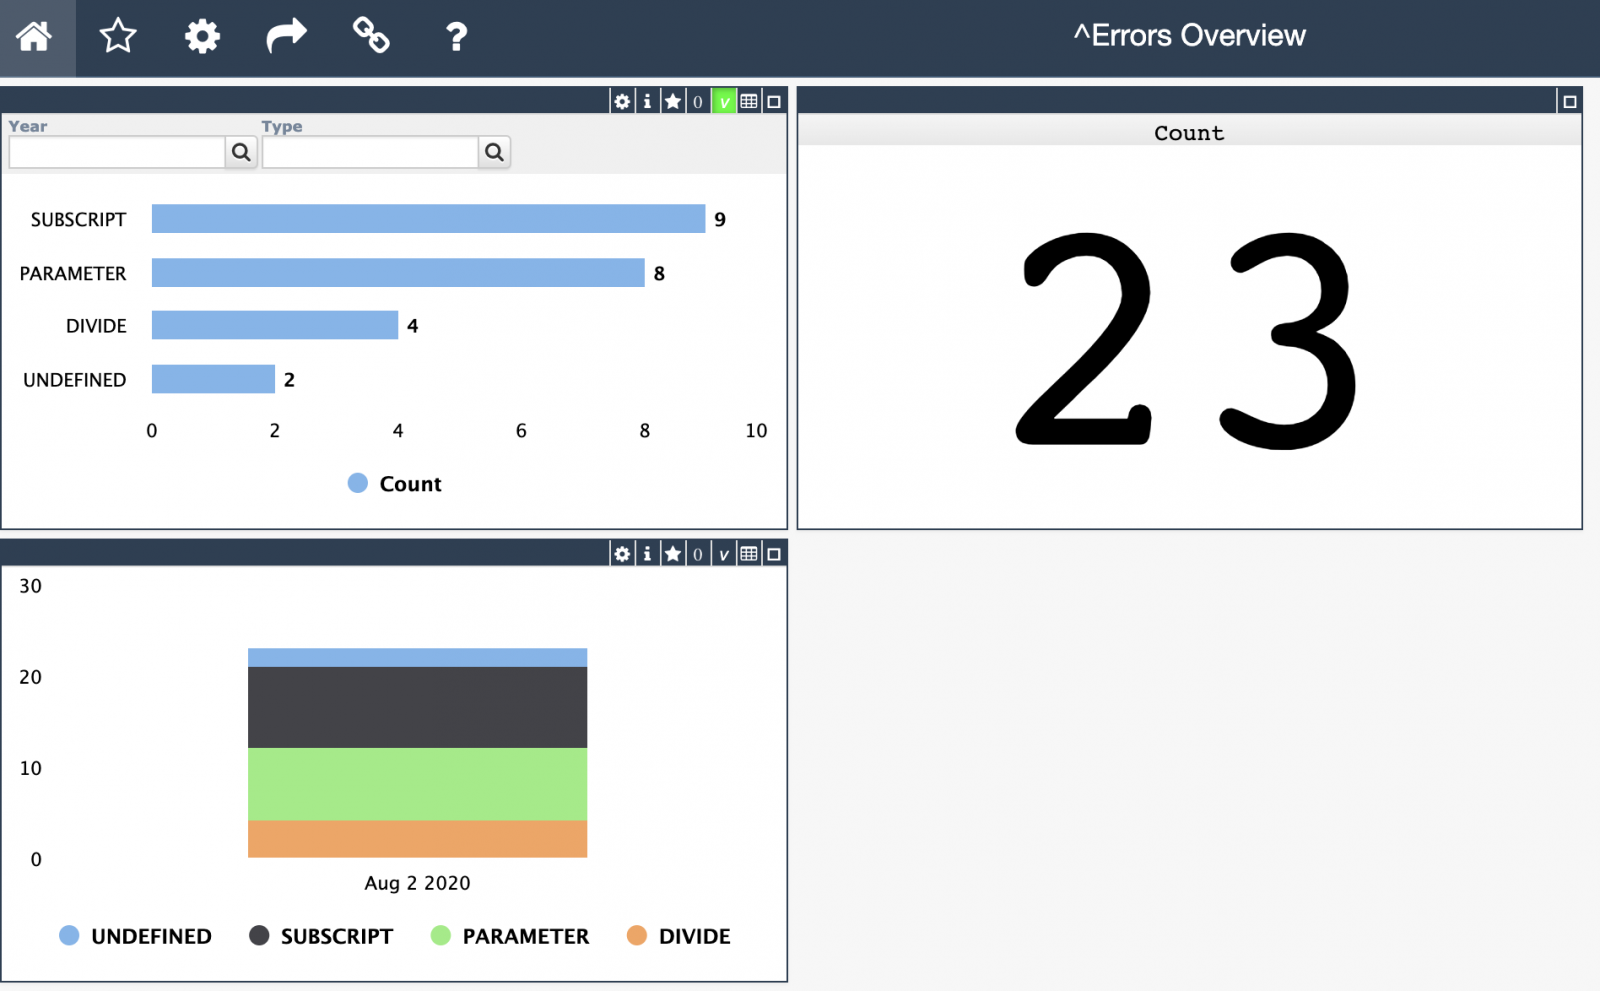
The typical monitoring solution consists of an online dashboard with KPIs that are being actively updated.

The key use case is of monitoring is to visually observe the KPI of fresh data every moment to react in case of an emergency.

Interactive Analytics

This solution supposes a set of interactive dashboards with filters and drill-downs.

The key use case is to explore the data with filters and drill-downs making business decisions upon graph and table data visualization.

Reporting

Reporting solution provides a set of static (usually) reports in a form of HTML or pdf documents that deliver the data in graph and text form in a predesigned form and could be sent via email.

The typical use case of a reporting system is to obtain reports on a given period that will illustrate the status of the product, process, service, sales, etc that is crucial for the business.

How InterSystems products could be used to build such solutions? Let's discuss this below!

3 0
1 284

Learning Services Live Webinars are back!

At this year’s Global Summit, InterSystems debuted InterSystems IRIS Data Platform™, a single, comprehensive product that provides capabilities spanning data management, interoperability, transaction processing, and analytics. InterSystems IRIS sets a new level of performance for the rapid development and deployment of data-rich and mission-critical applications. Now is your chance to learn more!

3 1
0 500

Previously I have already tried to play with Google Data Studio when I connected it to InterSystems FHIRaaS. It has quite a nice UI, with a few chart types available out of the box, it can be quite easily connected to some plain tables (stored as CSV or JSON, for instance), and gives the ability to build quite flexible analytics over it. So, I have decided to implement a new connector to InterSystems Analytics (DeepSee), with the ability to select a cube and do some queries on it.

3 0
0 274

When we are at the starting stage of BI project development, we must remember that it is crucial to select the right tool for its implementation. Today we want to show you how one of the principal functionality of dashboards is implemented in different BI systems. Let's talk about drill down from both points of view: the dashboard development, and the convenience and clarity for the end user. We will touch on the applications of this technology in IRIS BI, Power BI and Tableau.

3 1
0 318

InterSystems IRIS Business Intelligence allows you to keep your cubes up to date in multiple ways. This article will cover building vs synchronizing. There are also ways to manually keep cubes up to date, but these are very special cases and almost always cubes are kept current by building or synchronizing.

2 1
0 461

A few months ago, I read this interesting article from MIT Technology Review, explaing how COVID-19 pandemic are issuing challenges to IT teams worldwide regarding their machine learning (ML) systems.

Such article inspire me to think about how to deal with performance issues after a ML model was deployed.

2 2
0 351
Announcement
· Mar 16, 2017
Articles' Views Analytics

Hi, Community!

I hope you know the option to use DeepSee analytics portal for Developer Community stats. You can find it in Community-Analytics menu.

Let me introduce the beta of new analytical dashboard 'Articles' Views', which is available in Authors folder.

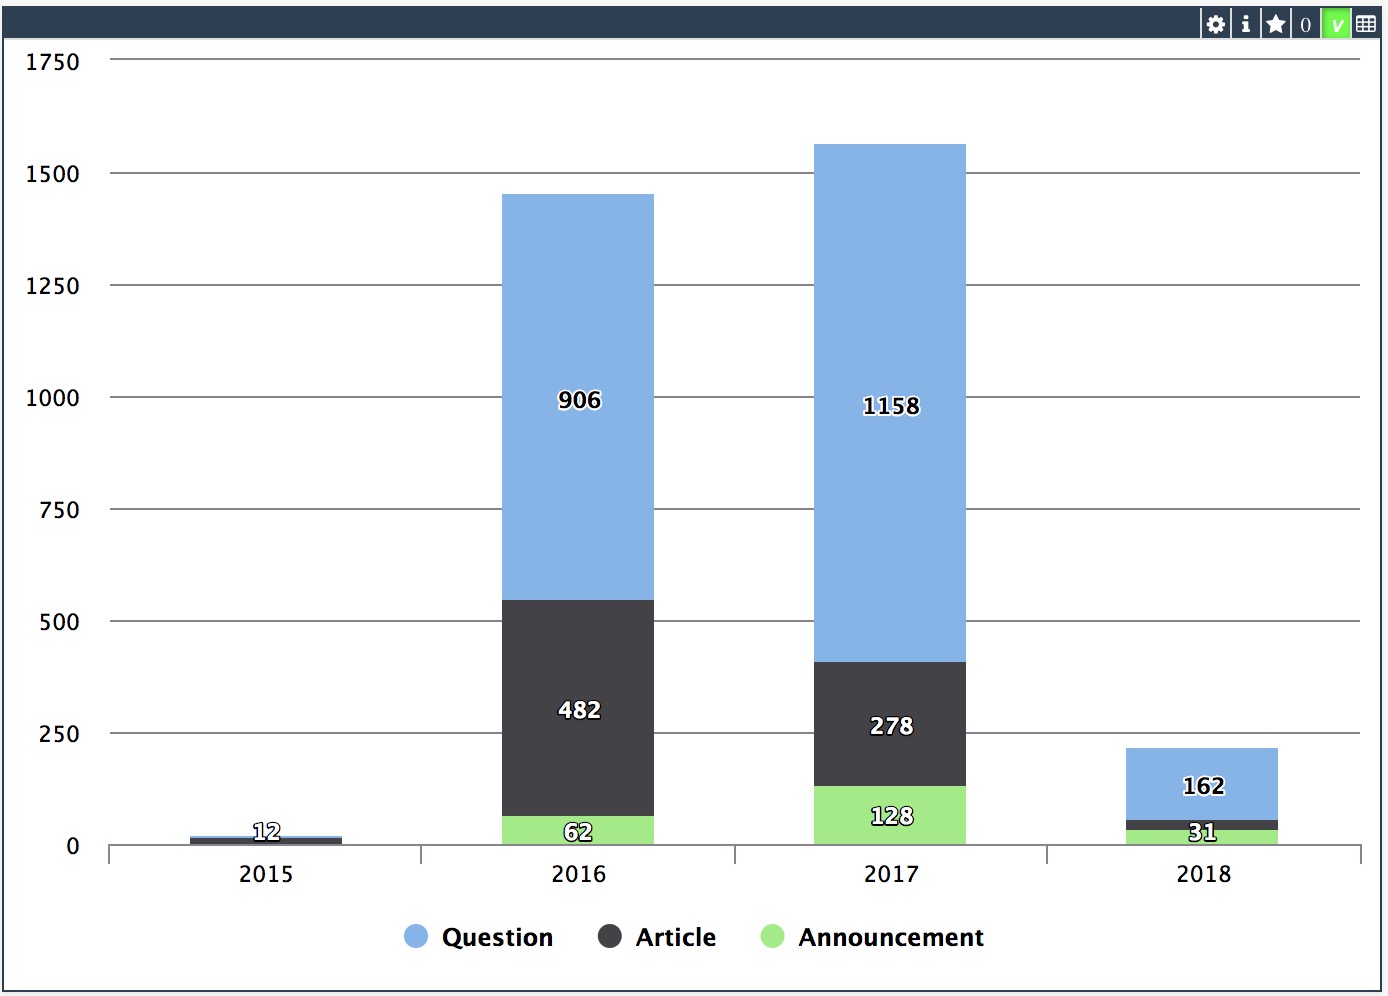
It consists of two dashboards, first shows the running total of the views for the articles (to see the impressive growing curve).

2 5
0 248
Article
· Nov 20, 2020 2m read
Enrich your analytics projects with NLP

According IDC, 80% of all data produced are NoSQL. See:

There are digital documents, scanned documents, online and offline texts, blob content into SQL, images, videos and audio. Imagine a Corporate Analytics initiative without all these data to analyze and support decisions?

In all the world, many projects are using techonologies to transform these NoSQL data into textual content, to allows analyze it. See:

2 0
2 203

With the release of InterSystems IRIS, we're also making available a nifty bit of software that allows you to get the best out of your InterSystems IRIS cluster when working with Apache Spark for data processing, machine learning and other data-heavy fun. Let's take a closer look at how we're making your life as a Data Scientist easier, as you're probably already facing tough big data challenges already, just from the influx of job offers in your inbox!

2 2
0 1,228

Hi, Community!

This is the 3rd part of DeepSee Web story - Angular base UI for DeepSee Dashboards, see the beginning here.

By design, DSW provides an implementation for every widget in DeepSee library. But there are some extra features in DSW which make solutions built with DSW dashboards more functional. This article describes it.

2 0
1 704

Hi, Community!

I’m sure you are using Developer Community analytics built with InterSystems Analytics technology DeepSee:

You can find DC analytics n InterSystems->Analytics menu.

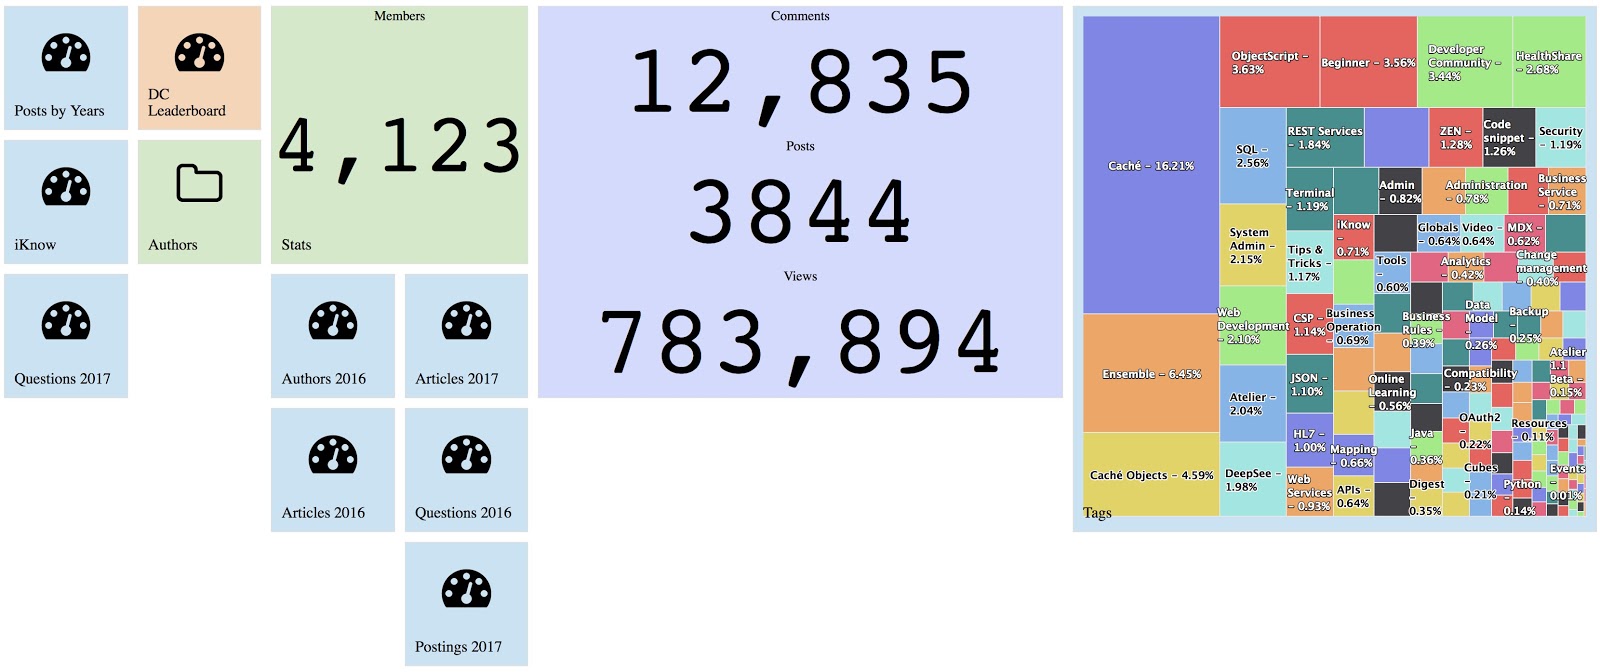
DC Analytics shows interactive dashboards on key figures of DC entities: Posts, Comments, and Members.

Since the last week, this analytics project is available for everyone with source code and data on DC Github!

2 1
1 495
Article
· Dec 31, 2019 3m read
Portlets that use data from DeepSee


In the previous part of this series, we saw how to reference a web page that will enhance our dashboard experience. Now we will look into referencing data that is already in our cubes.

In this example, we will be referencing the controller object and we will be extracting data from it. This data will then be displayed as text in our Dashboard. In Part 5, we will show how to incorporate this data into other charting libraries.

2 0
0 190
Announcement
· Sep 12, 2019
Python Gateway 0.8 release

I'm happy to announce the latest Python Gateway release.

This is not an InterSystems product, it is community supported open source project.

Download new release from GitHub.

Now for the new features.

Fast transfer. Pass globals, classes and tables from InterSystems IRIS to Python with ease and speed (10x faster than old QueryExecute). Documentation.

2 8
0 427

Hi all,

I recently discovered the Monitoring Activity Volume feature in IRIS and I was amazed by it. So, I put it to work in one of our productions. It is nice how easy it is to set up and all the possibilites that came with it.

But there's something weird: the numbers. Actually, one of the BP is stating a time of more than 6 seconds to process:

2 6
1 296