The MONITOR process (also called the Caché Monitor) scans the messages in your cconsole.log file and sends you emails based on the severity of those messages. The MONITOR is configured using the ^MONMGR utility in terminal.

The MONITOR should not be confused with the similarly named System Monitor, which checks a variety of system health and performance metrics and can log messages regarding them to the cconsole.log, where they can then be scanned by the MONITOR.

2 6
2 1.4K

Hi all,

I recently discovered the Monitoring Activity Volume feature in IRIS and I was amazed by it. So, I put it to work in one of our productions. It is nice how easy it is to set up and all the possibilites that came with it.

But there's something weird: the numbers. Actually, one of the BP is stating a time of more than 6 seconds to process:

2 6
1 386

Hi All

I'm looking for the a simple-quick-easy solution to monitor a SQL table thought Ensemble.

I have a process that update a DataBase ,a scheduled task that runs every night (Not Ensemble)

In the end it updates a table (replica_status) with a new recored with two fileds: Id, DateTime

I looked around the community but didn't find an answerd case.

I'm thinking on a Task that will run a sql outboud adapter BO that checks that table and send a alert if no new record was created yesterday

is this the right approach or is there's a better solution?

0 5
0 465

Off the back of the Interface Monitoring post I had created a class that queries the Ens.AlertRequest global and returns the entries between 6pm the night before and 6am in the morning.

I tested this build in our T&D environments and the build worked very well.

However in our production environment the query is being truncated, by what I believe to be a timeout and I get a partial query output.

In the System>SQL pages my 12 hour query times out.

0 5
0 252
Article
· Jun 9, 2016 1m read
Ensemble monitoring

First post! In order to somewhat redeem myself for an unnecessary call to support, I've decided to post some classes that I've written to monitor certain metrics inside our Ensemble Live instance (yeah, Kyle, you WERE laughing at me, but it's okay). What the classes do is to run queries and code to get database sizes, status of the mirror, counts of rows in tables such as EnsLib.HL7.Message and Ens.MessageHeader. The data is collected and written to tables and then an email is sent out daily upon completion. I've found this quite useful in keeping an eye on what's going on. It's help

5 5
1 965
Article
· Feb 25, 2019 4m read
Using Grafana directly from IRIS

There have been some very helpful articles in the community that show how to use Grafana with IRIS (or Cache/Ensemble) by using an intermediate database.

But I wanted to get at IRIS structures directly. In particular, i wanted to access the Cache History monitor data that is accessible by SQL as described here

https://community.intersystems.com/post/apm-using-cach%C3%A9-history-mon...

and didn't want anything between me and the data.

9 5
4 1.6K

Hi Developers,

Our first Online Developer Roundtable of 2024 will take place on March 5th at 9 am ET | 3 pm CET.

Tech talks:

  1. ObjectScript Unit Testing Tools, Techniques and Best Practices - by @Timothy Leavitt , Development Manager, Application Services, InterSystems
  2. Monitoring and Alerting Capabilities of InterSystems IRIS - by @Mark Bolinsky , Principal Technology Architect, InterSystems Mark's presentation is rescheduled for the roundtable in April.

Update: watch the recording of the roundtable below:

https://www.youtube.com/embed/mIAMvaCHlk8
[This is an embedded link, but you cannot view embedded content directly on the site because you have declined the cookies necessary to access it. To view embedded content, you would need to accept all cookies in your Cookies Settings]

5 5
1 333

Hi:

Currently we are using an older Healthshare instance but I am not opposed to using IRIS as we will upgrade eventually.

Currently for monitoring productions we have a Montior screen. We have both the Queues page and a Deepsee dashboard which has current status of our services. The issue with the Deepsee method we currently have with traffic lights is 1) the page is a bit slow to load the metrics 2) any new services from the team a new widget needs created and although this is easy enough to do it just is time consuming.

0 5
0 441
Question
· Apr 1, 2024
stdout logging

In The Business Process and the Business Operation, I am using the following code to get the value of TimeCreated and TimeProcessed

BP:

%Ensemble("Process").%PrimaryRequestHeader.TimeCreated

%Ensemble("Process").%PrimaryRequestHeader.TimeProcessed

BO:

..%RequestHeader.TimeCreated

..%RequestHeader.TimeProcessed

But I am trying to use ..%RequestHeader.TimeCreated in Business Service it is not storing any value.

How to get the value of TimeCreated and TimeProcessed in Business Service?

0 5
0 153
Article
· Aug 16, 2023 11m read
Http request response time monitoring

Hi developers!

Today I would like to address a subject that has given me a hard time. I am sure this must have been the case for quite a number of you already (so-called “the bottleneck”). Since this is a broad topic, this article will only focus on identifying incoming HTTP requests that could be causing slowness issues. I will also provide you with a small tool I have developed to help identify them.

Our software is becoming more and more complex, processing a large number of requests from different sources, be it front-end or third-party back-end applications. To ensure optimal performance, it is essential to have a logging system capable of taking a few key measurements, such as the response time, the number of global references and the number of lines of code executed for each HTTP response. As part of my work, I get involved in the development of EMR software as well as incident analysis. Since user load comes mostly from HTTP requests (REST API or CSP application), the need to have this type of measurement when generalized slowness issues occur has become obvious.

13 5
9 1.2K
Article
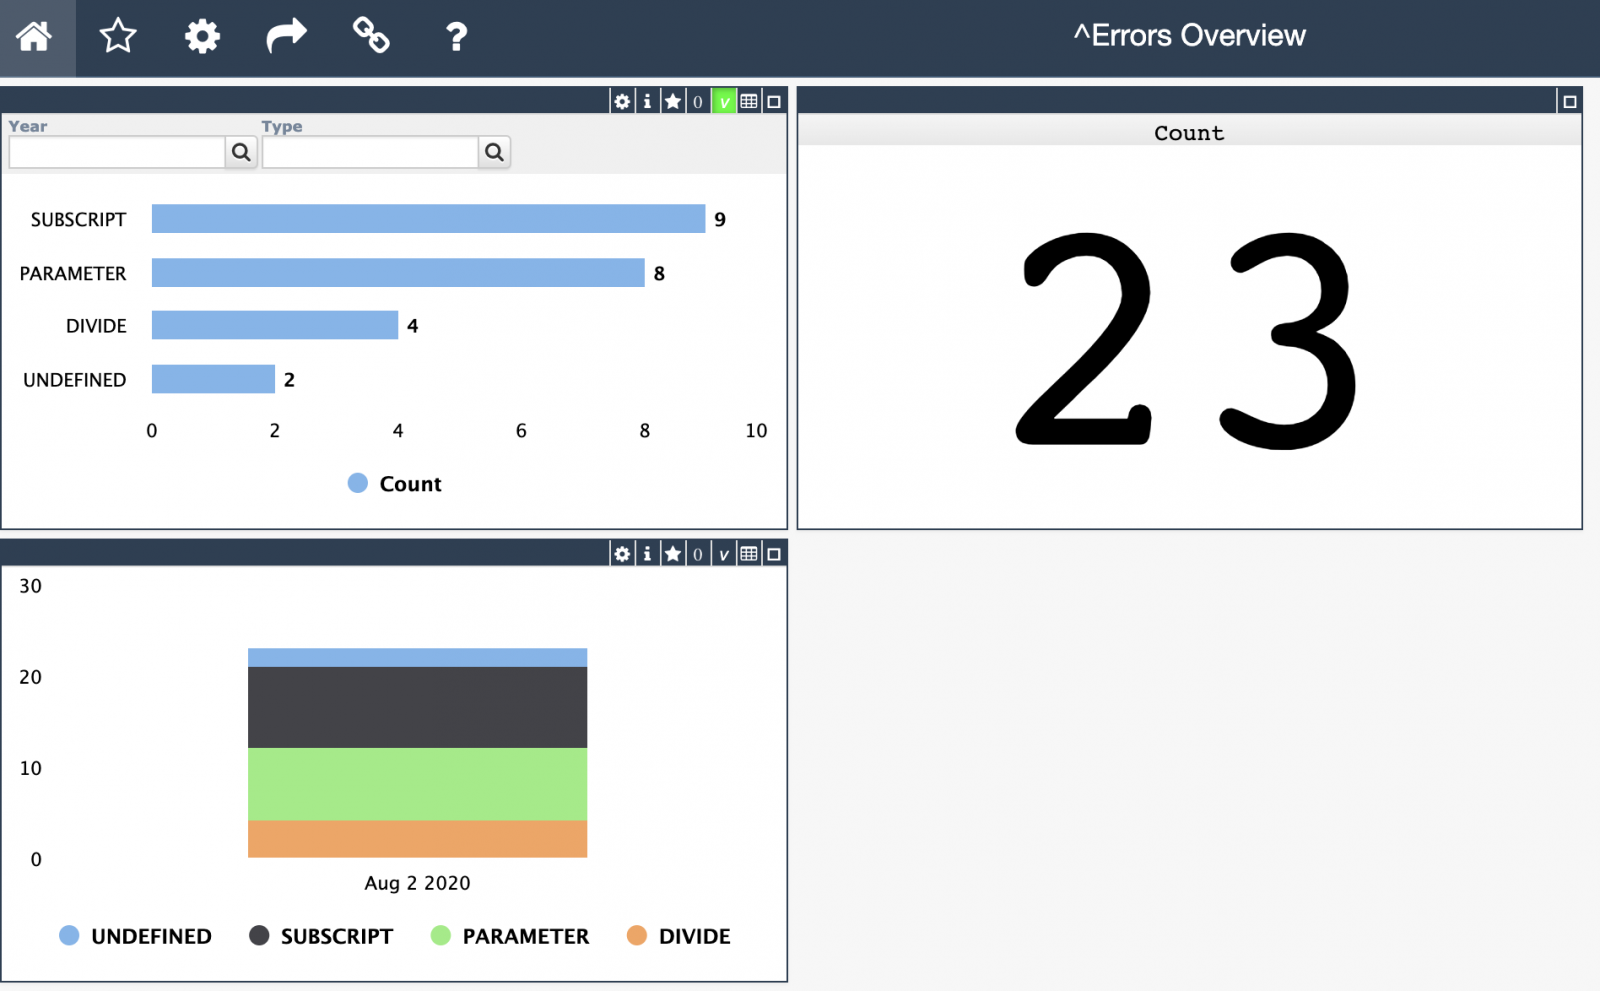
· Aug 2, 2020 1m read
Application Errors Analytics

Hi Developers!

As you know the application errors live in ^ERRORS global. They appear there if you call:

d e.Log() 

in a Catch section of Try-Catch.

With @Robert.Cemper1003's approach, you can now use SQL to examine it.

Inspired by Robert's module I introduced a simple IRIS Analytics module which shows these errors in a dashboard:

3 5
1 363

Whenever the Windows SNMP Service restarts, the snmpdbg log says the following.

16:58:25 :Debug tracing enabled for SNMP agent
16:58:25 :SnmpExtensionInit called, pid=4432, tid=12276
16:58:25 :CreateEvent for CacheSNMPTrap suceeded
16:58:25 :register Cache OID 1.3.6.1.4.1.16563.1
16:58:25 :Get all Cache configs ... 16:58:25 :found 1 configs
16:58:25 :Add ENSEMBLE config to list ...

0 4
0 565

Hi,

We want to monitor an Ensemble Production and send custom email alerts in function of some Rules. For example, if we normally receive 1 message per second, if suddenly we receive 5 or more messages per second, we want to send an email alert. And if tomorrow we don't want to check this again, we want to disable it through Ensemble Business Rules.

0 4
0 1.2K

Hi,

During the implementation of iris-history-monitor using ZPM, I'm bumping on the following scenario:

My Installer.cls has a call for the Custom Sensors Class method. The Custom information looks like a charm as I described in this article:

IRIS History Monitor using custom built-in REST API /api/monitor/metrics

But, now I'm trying to replicate the same behavior using the module.xml to work with ZPM.

0 4
0 264

I want to understand how this message is build:

[SYSTEM MONITOR] CPUusage Alert: CPUusage = 99, 99, 99 (Max value is 85).

Caché keep a log of cpu usage (99,99,99) and how is the frequency of check of this?

how can i chance the max value? is that possible?

Best,

0 4
0 928

Hello,

I am currently having the experience activating prometheus for iris db.

This environment that I speak uses IKO as a base.

I need to put 3 notes in the iris service area.

Are they:

annotations:
   prometheus.io/path: "/monitor/metrics"
   prometheus.io/port: "52772"
   prometheus.io/scrape: "true"

I'm not finding this possibility in the IKO documentation.

Has anyone had this experience and can help us with this challenge?

0 4
0 267

Hello

I have a problem on enabling SNMP monitoring on Cache.

I installed on HP UX NET SNMP 5.7.2 package from HP Software Center and enabled agentX protocol in snmpd.cfg.

When I enabled full debugging on Cache and NET SNMP I discovered that sent and received packets on both sides are not the same. Some bytes are different. I think the problem is in default charset for TCP/IP connection which is on our system set to CP1250 instead of default RAW. So result is that Cache notifies are not visibile from snmpwalk etc.

Is there a solution for this issue?

0 4
0 241

Internally we use splunk for monitoring applications and network.

Does Ensemble have a way of exposing internal metrics and/or a way of exposing custom built metrics?

I've used Deepsee dashboards in the past to monitor Apache Tomcat/Apache Camel/hawtio using JMX rest calls. This is the other way around and ideally I'd like to expose metrics on:

0 3
0 1.2K