Http request response time monitoring
Hi developers!
Today I would like to address a subject that has given me a hard time. I am sure this must have been the case for quite a number of you already (so-called “the bottleneck”). Since this is a broad topic, this article will only focus on identifying incoming HTTP requests that could be causing slowness issues. I will also provide you with a small tool I have developed to help identify them.
Our software is becoming more and more complex, processing a large number of requests from different sources, be it front-end or third-party back-end applications. To ensure optimal performance, it is essential to have a logging system capable of taking a few key measurements, such as the response time, the number of global references and the number of lines of code executed for each HTTP response. As part of my work, I get involved in the development of EMR software as well as incident analysis. Since user load comes mostly from HTTP requests (REST API or CSP application), the need to have this type of measurement when generalized slowness issues occur has become obvious.
Response time measurement
One of the most relevant elements to evaluate the performance of an application is the response time. Each request must be answered within a reasonable time to provide a satisfactory user experience. This is why by recording the response time for each request, a logging system helps us identify bad performance. We can also use this information to pinpoint which APIs or CSPs are slower than others in order to optimize them and thus increase the overall execution of the application.
The global reference number
Although the response time is a critical characteristic, we should not neglect the number of global references either. We should remember that disk access is often an expensive operation in terms of execution time too. The efficiency of the IRIS cache can mask this problem though. What I mean by that is that if many global cached references are accessed simultaneously, the response time is outstanding. Still, the performance drops considerably as soon as the data we access comes from outside the cache. In other words, in a system where multiple requests are made concurrently, excessive use of disk access can cause significant slowdowns. A log system that measures global access references for each request makes it also possible for us to detect HTTP requests that excessively solicit resources. By identifying such issues, developers can make changes to minimize this access (by adding indexes, optimizing SQL queries, changing the logic, etc.)
Number of lines of code executed
Counting the number of lines of code executed for each request provides us with a measure of the complexity and magnitude of the operations performed. This metric helps us identify queries that run too many lines of code, which may indicate pieces of the code that require optimization. In most cases, the problem lies in the number of global references. However, in the event of a complex part of code being only the manipulation of memory data with little access to the database, this measurement will make it possible to highlight it (for example, if there is a problem with loops).
Anomaly detection
A system log can also be used to detect anomalies in response query performance. By recording these measurements, you can identify requests that are out of the ordinary. For instance, if a query that typically runs fast suddenly starts taking longer or accessing the disk excessively, this may mean that there is a potential problem that requires immediate attention (e.g. increased response time after an application update). Keep in mind that early anomaly detection helps us quickly resolve performance issues and ensures a good user experience.
Package web-timing-logger
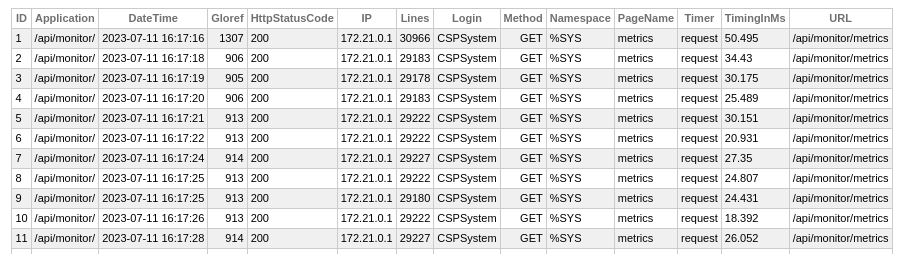
Recently, I have developed a small tool for the community that allows us to log all incoming HTTP requests. It is available on Open Exchange if you got interested in it. This tool notably records the key metrics discussed in this article: number of lines of code executed, number of global referrals, and response time. It also logs some information about the caller that can come in handy for debugging:
- Date and time.
- The user logged in.
- Caller's IP address.
- URL.
- Execution namespace.
- Application web.
- Page name (if applicable).
- URL without parameters.
In addition to that, it also offers the ability to integrate custom metrics with SAM (“/api/monitor”), which can allow you to incorporate them into Prometheus and make a dashboard with Grafana.
There is a series of data per web application, page, or route (if it’s a REST application) aggregated per day as well as per quarter-hour:
- Total hit: Number of requests received.
- Total timing: cumulative response time for all requests.
- Max timing: slowest response time.
- Average timing: average response time.
The same metrics are available as well for global references and lines of code executed.
![]()
![]()
Below you can see an example with the metrics enabled on the web applications “/api/monitor/” and “/csp/sys/exp/”:
webmeasure_average_gloref{id="/api/monitor/"} 903.5227272727272727
webmeasure_average_gloref{id="/api/monitor/metrics"} 903.5227272727272727
webmeasure_average_gloref{id="/csp/sys/exp/"} 1853.6875
webmeasure_average_gloref{id="/csp/sys/exp/%CSP.Broker.cls"} 1242.933333333333333
webmeasure_average_gloref{id="/csp/sys/exp/%CSP.UI.Portal.SQL.Home.zen"} 11015
webmeasure_average_gloref_current_quarter{id="/api/monitor/"} 903.5227272727272727
webmeasure_average_gloref_current_quarter{id="/api/monitor/metrics"} 903.5227272727272727
webmeasure_average_gloref_current_quarter{id="/csp/sys/exp/"} 1853.6875
webmeasure_average_gloref_current_quarter{id="/csp/sys/exp/%CSP.Broker.cls"} 1242.933333333333333
webmeasure_average_gloref_current_quarter{id="/csp/sys/exp/%CSP.UI.Portal.SQL.Home.zen"} 11015
webmeasure_average_lines{id="/api/monitor/"} 29365.5
webmeasure_average_lines{id="/api/monitor/metrics"} 29365.5
webmeasure_average_lines{id="/csp/sys/exp/"} 19415.5
webmeasure_average_lines{id="/csp/sys/exp/%CSP.Broker.cls"} 11570.73333333333333
webmeasure_average_lines{id="/csp/sys/exp/%CSP.UI.Portal.SQL.Home.zen"} 137087
webmeasure_average_lines_current_quarter{id="/api/monitor/"} 29365.5
webmeasure_average_lines_current_quarter{id="/api/monitor/metrics"} 29365.5
webmeasure_average_lines_current_quarter{id="/csp/sys/exp/"} 19415.5
webmeasure_average_lines_current_quarter{id="/csp/sys/exp/%CSP.Broker.cls"} 11570.73333333333333
webmeasure_average_lines_current_quarter{id="/csp/sys/exp/%CSP.UI.Portal.SQL.Home.zen"} 137087
webmeasure_average_timing_in_ms{id="/api/monitor/"} 27.27256818181818182
webmeasure_average_timing_in_ms{id="/api/monitor/metrics"} 27.27256818181818182
webmeasure_average_timing_in_ms{id="/csp/sys/exp/"} 16.6
webmeasure_average_timing_in_ms{id="/csp/sys/exp/%CSP.Broker.cls"} 9.94633333333333333
webmeasure_average_timing_in_ms{id="/csp/sys/exp/%CSP.UI.Portal.SQL.Home.zen"} 116.405
webmeasure_average_timing_in_ms_current_quarter{id="/api/monitor/"} 27.27256818181818182
webmeasure_average_timing_in_ms_current_quarter{id="/api/monitor/metrics"} 27.27256818181818182
webmeasure_average_timing_in_ms_current_quarter{id="/csp/sys/exp/"} 16.6
webmeasure_average_timing_in_ms_current_quarter{id="/csp/sys/exp/%CSP.Broker.cls"} 9.94633333333333333
webmeasure_average_timing_in_ms_current_quarter{id="/csp/sys/exp/%CSP.UI.Portal.SQL.Home.zen"} 116.405
webmeasure_max_lines{id="/api/monitor/"} 29498
webmeasure_max_lines{id="/api/monitor/metrics"} 29498
webmeasure_max_lines{id="/csp/sys/exp/"} 137087
webmeasure_max_lines{id="/csp/sys/exp/%CSP.Broker.cls"} 45208
webmeasure_max_lines{id="/csp/sys/exp/%CSP.UI.Portal.SQL.Home.zen"} 137087
webmeasure_max_lines_current_quarter{id="/api/monitor/"} 29498
webmeasure_max_lines_current_quarter{id="/api/monitor/metrics"} 29498
webmeasure_max_lines_current_quarter{id="/csp/sys/exp/"} 137087
webmeasure_max_lines_current_quarter{id="/csp/sys/exp/%CSP.Broker.cls"} 45208
webmeasure_max_lines_current_quarter{id="/csp/sys/exp/%CSP.UI.Portal.SQL.Home.zen"} 137087
webmeasure_max_timing{id="/api/monitor/"} 40.783
webmeasure_max_timing{id="/api/monitor/metrics"} 40.783
webmeasure_max_timing{id="/csp/sys/exp/"} 116.405
webmeasure_max_timing{id="/csp/sys/exp/%CSP.Broker.cls"} 66.458
webmeasure_max_timing{id="/csp/sys/exp/%CSP.UI.Portal.SQL.Home.zen"} 116.405
webmeasure_max_timing_current_quarter{id="/api/monitor/"} 40.783
webmeasure_max_timing_current_quarter{id="/api/monitor/metrics"} 40.783
webmeasure_max_timing_current_quarter{id="/csp/sys/exp/"} 116.405
webmeasure_max_timing_current_quarter{id="/csp/sys/exp/%CSP.Broker.cls"} 66.458
webmeasure_max_timing_current_quarter{id="/csp/sys/exp/%CSP.UI.Portal.SQL.Home.zen"} 116.405
webmeasure_total_gloref{id="/api/monitor/"} 39755
webmeasure_total_gloref{id="/api/monitor/metrics"} 39755
webmeasure_total_gloref{id="/csp/sys/exp/"} 29659
webmeasure_total_gloref{id="/csp/sys/exp/%CSP.Broker.cls"} 18644
webmeasure_total_gloref{id="/csp/sys/exp/%CSP.UI.Portal.SQL.Home.zen"} 11015
webmeasure_total_gloref_current_quarter{id="/api/monitor/"} 39755
webmeasure_total_gloref_current_quarter{id="/api/monitor/metrics"} 39755
webmeasure_total_gloref_current_quarter{id="/csp/sys/exp/"} 29659
webmeasure_total_gloref_current_quarter{id="/csp/sys/exp/%CSP.Broker.cls"} 18644
webmeasure_total_gloref_current_quarter{id="/csp/sys/exp/%CSP.UI.Portal.SQL.Home.zen"} 11015
webmeasure_total_hit{id="/api/monitor/"} 44
webmeasure_total_hit{id="/api/monitor/metrics"} 44
webmeasure_total_hit{id="/csp/sys/exp/"} 16
webmeasure_total_hit{id="/csp/sys/exp/%CSP.Broker.cls"} 15
webmeasure_total_hit{id="/csp/sys/exp/%CSP.UI.Portal.SQL.Home.zen"} 1
webmeasure_total_hit_current_quarter{id="/api/monitor/"} 44
webmeasure_total_hit_current_quarter{id="/api/monitor/metrics"} 44
webmeasure_total_hit_current_quarter{id="/csp/sys/exp/"} 16
webmeasure_total_hit_current_quarter{id="/csp/sys/exp/%CSP.Broker.cls"} 15
webmeasure_total_hit_current_quarter{id="/csp/sys/exp/%CSP.UI.Portal.SQL.Home.zen"} 1
webmeasure_total_lines{id="/api/monitor/"} 1292082
webmeasure_total_lines{id="/api/monitor/metrics"} 1292082
webmeasure_total_lines{id="/csp/sys/exp/"} 310648
webmeasure_total_lines{id="/csp/sys/exp/%CSP.Broker.cls"} 173561
webmeasure_total_lines{id="/csp/sys/exp/%CSP.UI.Portal.SQL.Home.zen"} 137087
webmeasure_total_lines_current_quarter{id="/api/monitor/"} 1292082
webmeasure_total_lines_current_quarter{id="/api/monitor/metrics"} 1292082
webmeasure_total_lines_current_quarter{id="/csp/sys/exp/"} 310648
webmeasure_total_lines_current_quarter{id="/csp/sys/exp/%CSP.Broker.cls"} 173561
webmeasure_total_lines_current_quarter{id="/csp/sys/exp/%CSP.UI.Portal.SQL.Home.zen"} 137087
webmeasure_total_timing_in_ms{id="/api/monitor/"} 1199.993
webmeasure_total_timing_in_ms{id="/api/monitor/metrics"} 1199.993
webmeasure_total_timing_in_ms{id="/csp/sys/exp/"} 265.6
webmeasure_total_timing_in_ms{id="/csp/sys/exp/%CSP.Broker.cls"} 149.195
webmeasure_total_timing_in_ms{id="/csp/sys/exp/%CSP.UI.Portal.SQL.Home.zen"} 116.405
webmeasure_total_timing_in_ms_current_quarter{id="/api/monitor/"} 1199.993
webmeasure_total_timing_in_ms_current_quarter{id="/api/monitor/metrics"} 1199.993
webmeasure_total_timing_in_ms_current_quarter{id="/csp/sys/exp/"} 265.6
webmeasure_total_timing_in_ms_current_quarter{id="/csp/sys/exp/%CSP.Broker.cls"} 149.195
webmeasure_total_timing_in_ms_current_quarter{id="/csp/sys/exp/%CSP.UI.Portal.SQL.Home.zen"} 116.405
You could have noticed that the metrics illustrated above are very generic. I strongly encourage you to expand your metrics and make them personalized. It is necessary for proper monitoring of your applications.
Installation using ZPM
If you want to do a test install, and you are a Docker user, I recommend that you review this section for some practical information and move on to the next one. The container build is scripted to configure the environment automatically.
The installation is done with ZPM. Simple go to the IRIS terminal and do the following:
zpm "install web-timing-logger”Once installed, you need to initialize the settings, so just run:
Do ##class(dc.webtiming.Config).Initialize()By default, the HTTP request log and metrics are not active. To enable them, take the following steps:
Do ##class(dc.webtiming.Config).SetLogEnabled(1)

Do ##class(dc.webtiming.Config).SetMetricsEnabled(1)
In order for SAM (“/api/monitor”) to expose custom metrics, not only must you add a role to the web application /API/monitor, but also register a class in SYS.Monitor.SAM.Config, so run the following command:
Do ##class(dc.webtiming.Config).ConfigureAPIMonitor()If you want to use this utility in several web applications that run in different namespaces, it is crucial to map the package “dc.webtiming" as well as the globals "dc.webtiming*” in “%ALL”. To avoid doing it manually, use the method specified below:
Do ##class(dc.webtiming.Config).AddToPercentAllNS()All of the abovementioned actions can be performed in a single line with the next command:
Do ##class(dc.webtiming.Config).DefaultSetup()Installation using Docker
The beginning with Docker is classic. Clone the repository and start the container:
git clone https://github.com/lscalese/iris-web-timing-logger.git
docker-compose up -d
Activation on a web application
Now that we have configured the system, there is still one important detail to be settled to enable you to record the measurements. To understand what you need to do, you should know how the system works. To trigger measurement and recording, web-timing-logger uses events "OnStartRequest" and "OnEndRequest". These events are implemented in the class "dc.webtiming.CSPSessionEvents", which is a subclass of "%CSP.SessionEvents". Thus, each web application must be configured with the event class "dc.webtiming.CSPSessionEvents".
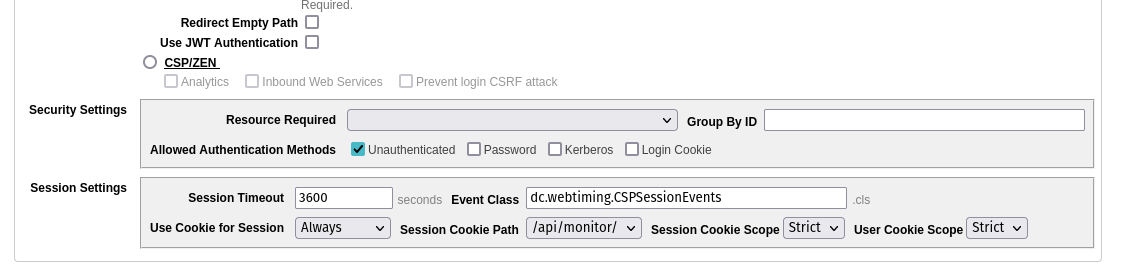
If your web application is already using another event class, don't worry! Just add the following calls to this class:
In the methodOnStartRequest:
Do ##class(dc.webtiming.Events).OnStart()and in the method OnEndRequest:
Do ##class(dc.webtiming.Events).OnEnd()This will add measurement and recording functionality to your existing event class.
Perform this configuration for all web applications you want to measure.
In the case, you have an empty system and only want to do some tests, use the configuration on the /API/monitor application. Since access to metrics is established via an HTTP call, they can also be measured to generate logs. So just open your browser and access the page http://localhost:49165/api/monitor/metrics several times (adapt it with your port number). You will notice that the metrics “webmeasure” are powered, and the table “dc_webtiming_log.Request“ is filled with data from HTTP requests:
SELECT *
FROM dc_webtiming_log.Request
Even though Web-timing-logger makes it easy to identify problematic entry points in web applications, it does not provide precise information on the specific parts of the code that are causing troubles. Once the entry point has been identified, you can use other tools, such as OEX ZProfile, developed by Dmitry Maslennikov. It can perform an in-depth analysis of the code that is being executed. Check out a dedicated article here.
Well, that's all for today. There are, of course, other things that we could address on “web-timing-logger”, such as cleaning logs, Grafana dashboard example, or even some interesting SQL queries. I hope you enjoyed the article will give you ideas for monitoring your applications. I might write a sequel if you are interested in it.
See you soon!
Comments
Wow, neat work, I can see that in your source code that you have pre build grafana dashboard, can you share screenshot of them ?
Hi @Guillaume Rongier !
Thank you!
Yes, I continue working on this project after writing this article.
I have to write a sequel.
You can see a summary of the activity on this dashboard : 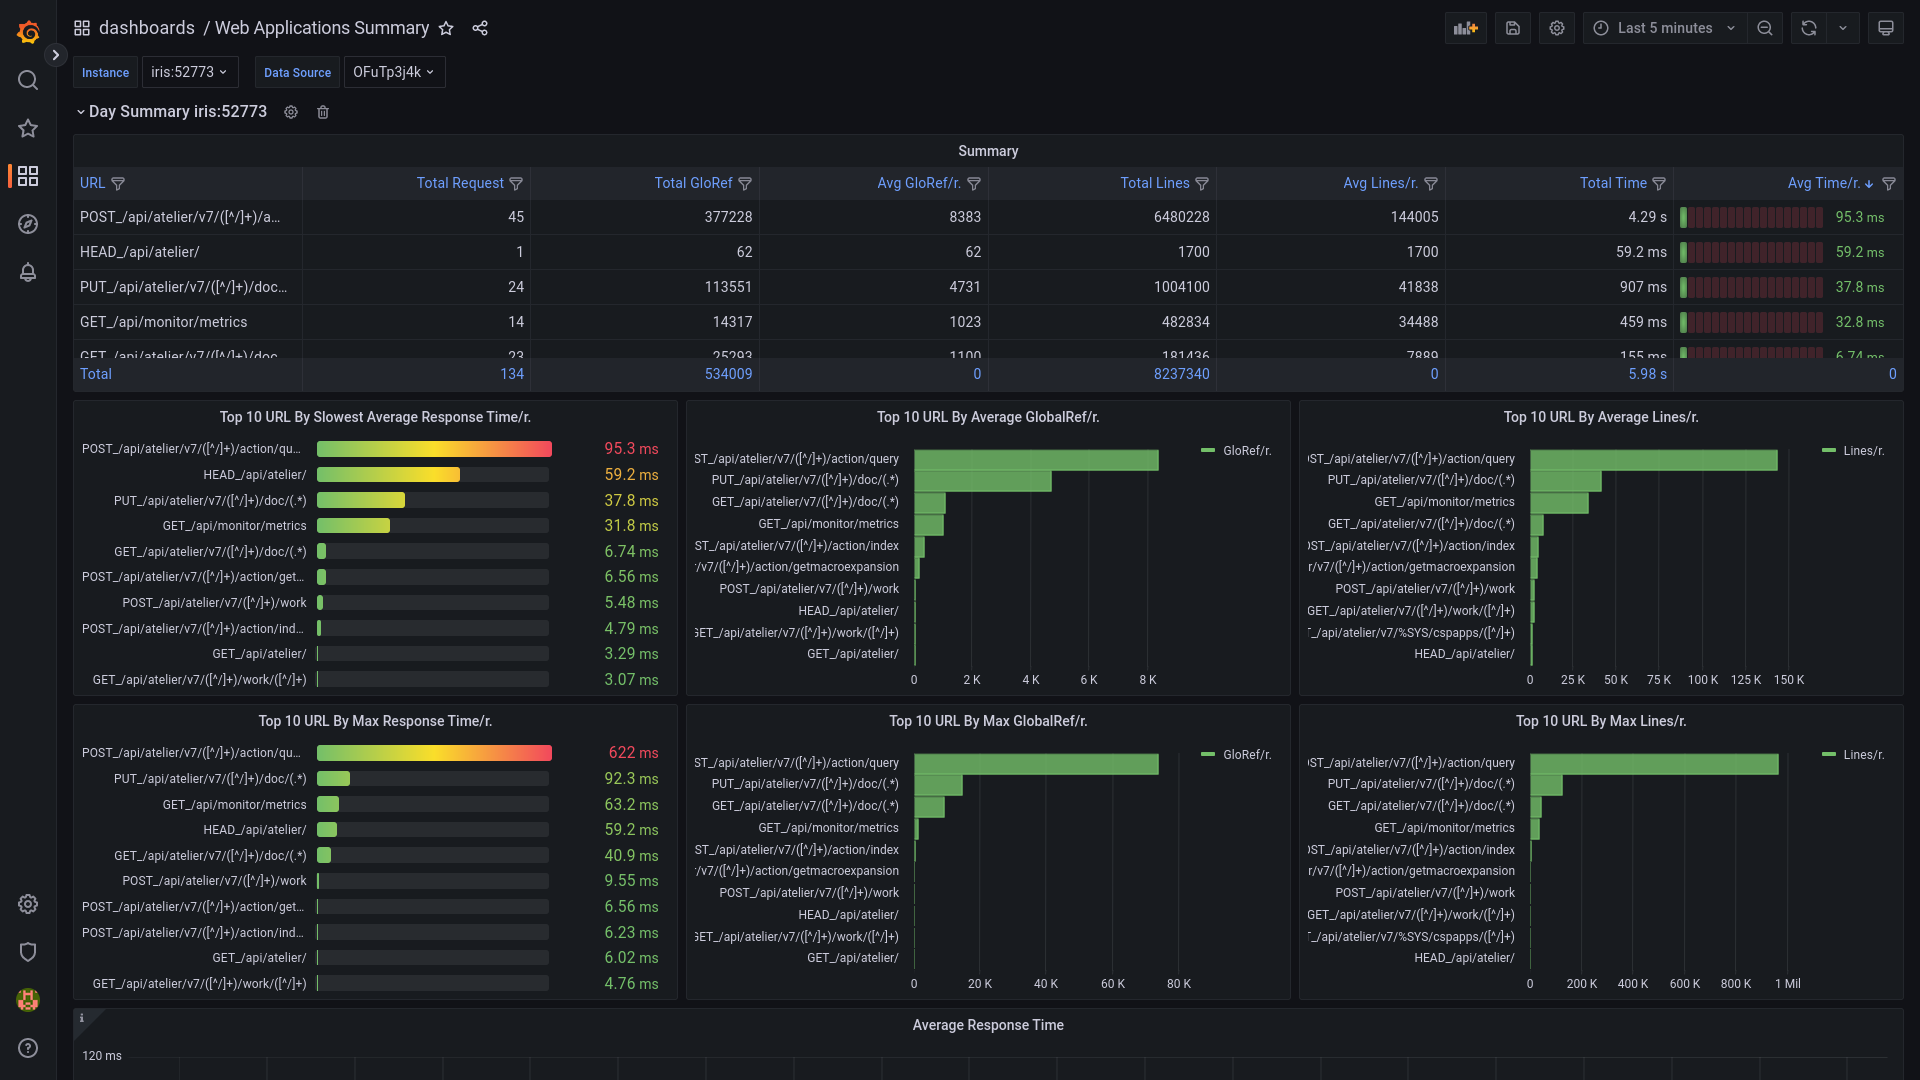
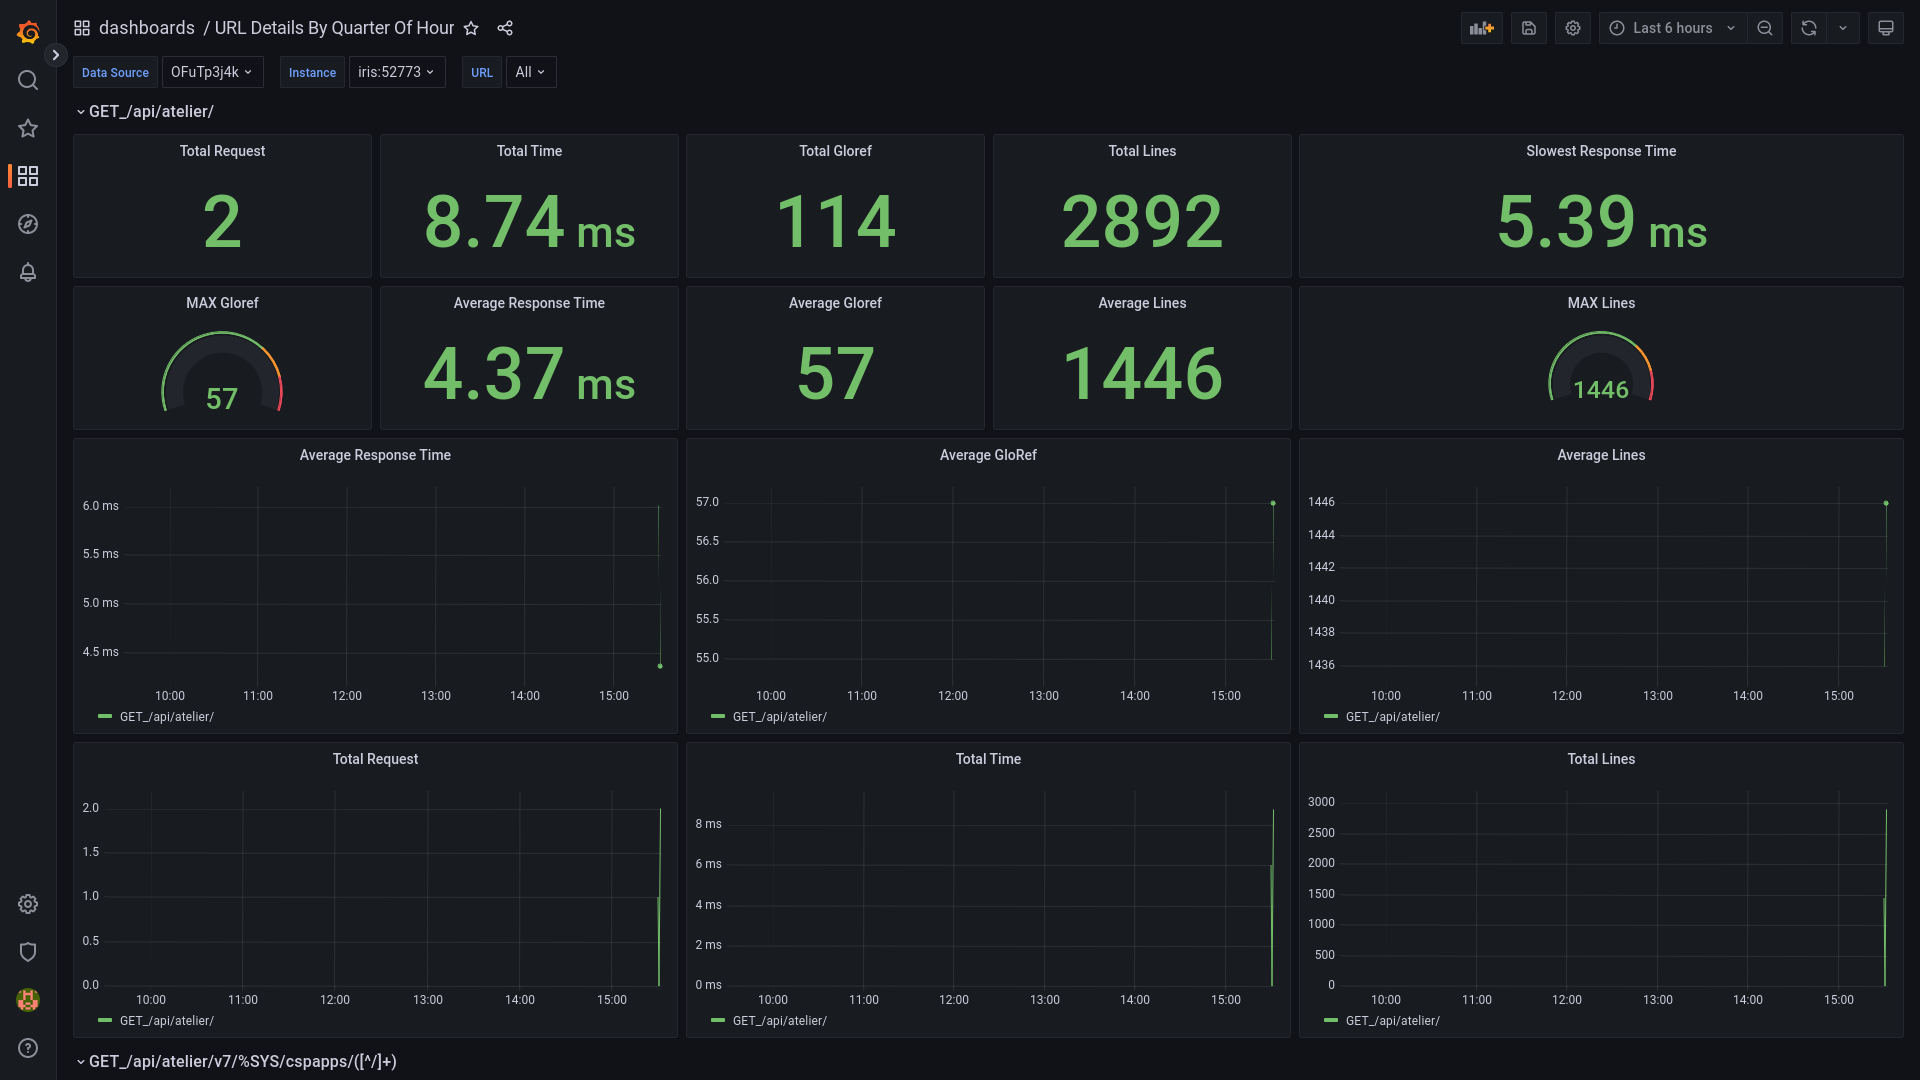
And the detail for a CSP\REST here:
Nice work Lorenzo, especially in extending the SAM inheritance tree for projection!
💡 This article is considered as InterSystems Data Platform Best Practice.
Nice! What performance hit are we talking about? No way this level of detail is free.