Article
· Dec 22, 2016 2m read
The Polymetric Dashboard

> Customizable System Monitoring. ## Introduction The Polymetric Dashboard is a stand-alone module that provides enhanced monitoring tools for a Caché environment. Equipped with over one hundred sensors that monitor key system metrics, a robust REST API, and a modular AngularJS user interface, the Polymetric Dashboard is fully functional out of the box. However, the Polymetric Dashboard is designed to be customizable; any system metric can be monitored by creating a new sensor, and the visualization of collected data can be tailored to specific requirements and purposes.

9 20
1 1.6K

Hi community,

The aim of this article is to explain how to create messaging between IRIS and Microsoft Teams.

In my company, we wanted to monitor error messages, and we used the Ens.Alert class to redirect those error messages through a Business Operation that sent an email.
The problem was that we sent those error messages to a support account where there were many emails. We wanted something specific for a specific team.

So we investigated how to make these messages reach the development team directly and they could have, in real time, a notification of an error in our production.
In our company we use Microsoft Teams as a corporate tool, so we asked ourselves: How could we make these messages reach the IRIS development team?

31 14
7 634
Article
· Feb 13, 2017 14m read
Creating custom SNMP OIDs

This post is dedicated to the task of monitoring a Caché instance using SNMP. Some users of Caché are probably doing it already in some way or another. Monitoring via SNMP has been supported by the standard Caché package for a long time now, but not all the necessary parameters are available “out of the box”. For example, it would be nice to monitor the number of CSP sessions, get detailed information about the use of the license, particular KPI’s of the system being used and such. After reading this article, you will know how to add your parameters to Caché monitoring using SNMP.

11 14
2 11.4K

The following steps show you how to display a sample list of metrics available from the /api/monitor service.

In the last post, I gave an overview of the service that exposes IRIS metrics in Prometheus format. The post shows how to set up and run IRIS preview release 2019.4 in a container and then list the metrics.


This post assumes you have Docker installed. If not, go and do that now for your platform :)

18 10
6 1.4K
Article
· Jan 15, 2016 1m read
Activity Monitor in Ensemble 2016.1

Has anyone tried the new Activity Volume Statistics and Monitoring in Ensembel 2016.1? I would love to get some feedback.

If you haven't read about this, there is a dashboard that provides counts and response times for messages sent and received by each configuration item. Alternatively the underlying data is arranged in tables that should make it easy for you to use your favorite SQL reporting tools to generate reports for short term performance monitoring or longer term capacity planning.

Dave

0 9
2 1K

One of the topics that comes up often when managing Ensemble productions is disk space:

The database (the CACHE.DAT file) grows in a rate that was unexpected; or the Journal files build up at a fast pace; or the database grows continuously though the system has a scheduled purge of the Ensemble runtime data.

It would have been better if these kind of phenomena would have been observed and accounted for yet at the development and testing stage rather than on a live system.

For this purpose I created a basic framework that could aid in this task.

4 7
2 1.3K

The MONITOR process (also called the Caché Monitor) scans the messages in your cconsole.log file and sends you emails based on the severity of those messages. The MONITOR is configured using the ^MONMGR utility in terminal.

The MONITOR should not be confused with the similarly named System Monitor, which checks a variety of system health and performance metrics and can log messages regarding them to the cconsole.log, where they can then be scanned by the MONITOR.

2 6
1 1.4K
Article
· Aug 2, 2020 1m read
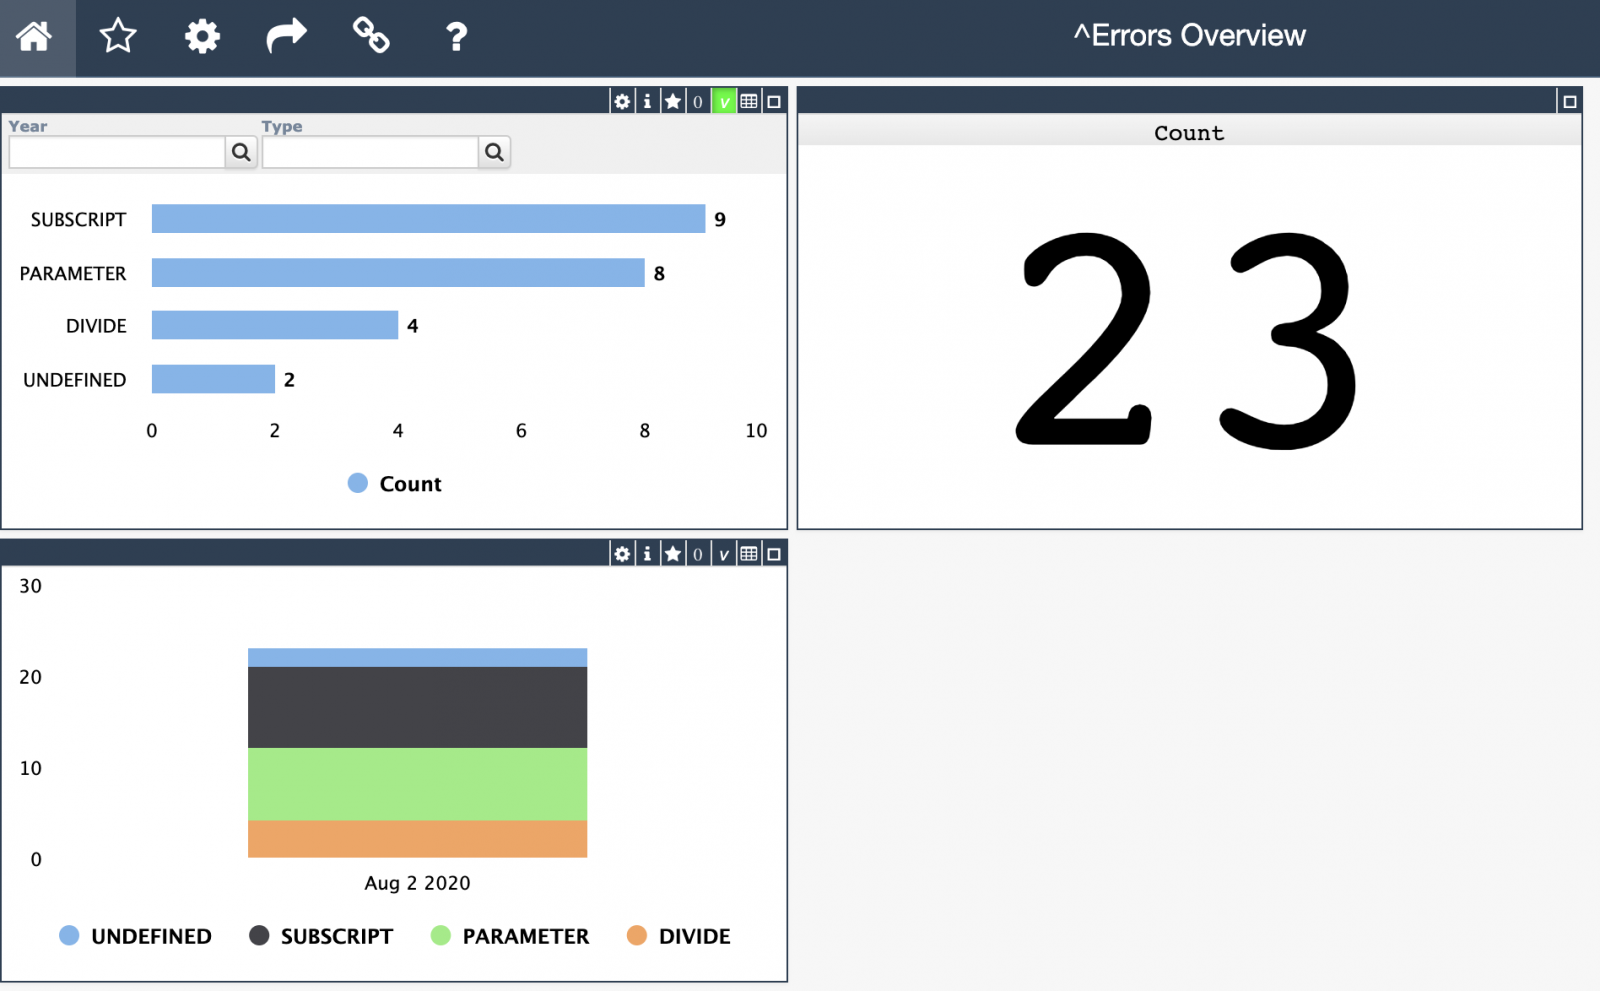
Application Errors Analytics

Hi Developers!

As you know the application errors live in ^ERRORS global. They appear there if you call:

d e.Log() 

in a Catch section of Try-Catch.

With @Robert Cemper's approach, you can now use SQL to examine it.

Inspired by Robert's module I introduced a simple IRIS Analytics module which shows these errors in a dashboard:

3 5
1 332
Article
· Jun 9, 2016 1m read
Ensemble monitoring

First post! In order to somewhat redeem myself for an unnecessary call to support, I've decided to post some classes that I've written to monitor certain metrics inside our Ensemble Live instance (yeah, Kyle, you WERE laughing at me, but it's okay). What the classes do is to run queries and code to get database sizes, status of the mirror, counts of rows in tables such as EnsLib.HL7.Message and Ens.MessageHeader. The data is collected and written to tables and then an email is sent out daily upon completion. I've found this quite useful in keeping an eye on what's going on. It's help

5 5
1 930
Article
· Feb 25, 2019 4m read
Using Grafana directly from IRIS

There have been some very helpful articles in the community that show how to use Grafana with IRIS (or Cache/Ensemble) by using an intermediate database.

But I wanted to get at IRIS structures directly. In particular, i wanted to access the Cache History monitor data that is accessible by SQL as described here

https://community.intersystems.com/post/apm-using-cach%C3%A9-history-mon...

and didn't want anything between me and the data.

9 5
4 1.5K
Article
· Aug 16, 2023 11m read
Http request response time monitoring

Hi developers!

Today I would like to address a subject that has given me a hard time. I am sure this must have been the case for quite a number of you already (so-called “the bottleneck”). Since this is a broad topic, this article will only focus on identifying incoming HTTP requests that could be causing slowness issues. I will also provide you with a small tool I have developed to help identify them.

Our software is becoming more and more complex, processing a large number of requests from different sources, be it front-end or third-party back-end applications. To ensure optimal performance, it is essential to have a logging system capable of taking a few key measurements, such as the response time, the number of global references and the number of lines of code executed for each HTTP response. As part of my work, I get involved in the development of EMR software as well as incident analysis. Since user load comes mostly from HTTP requests (REST API or CSP application), the need to have this type of measurement when generalized slowness issues occur has become obvious.

13 5
9 1K

APM normally focuses on the activity of the application but gathering information about system usage gives you important background information that helps understand and manage the performance of your application so I am including the IRIS History Monitor in this series.

In this article I will briefly describe how you start the IRIS or Caché History Monitor to build a record of the system level activity to go with the application activity and performance information you gather. I will also give examples of SQL to access the information.

6 3
2 1.7K
Article
· Jul 12, 2019 2m read
Basic Database Metrics example

This is a self contained class that can be run from the Intersystems Task Scheduler which records peak usage details for databases and licenses built up throughout the day and retaining 30 days history.

To schedule the task to run every hour:

d ##class(Metrics.Task).Schedule()

You can also specify your own start time, stop time, and run interval:

d ##class(Metrics.Task).Schedule(startTime, stopTime, intervalMins)

Metrics are stored in ^Metrics in the namespace that the class resides in/is run from.

6 3
3 555

When you have been using cubes for business intelligence in a namespace for some time, you may find that there are many cubes in the namespace, only some of which are actively being used. However, it can be difficult to tell which cubes users are or are not querying, and maintaining unused cubes can be costly both in terms of storage and of computation to keep them up to date. This article provides some suggestions and examples for monitoring which cubes are in active use, and for removing cubes that you determine are no longer necessary.

5 2
2 473