Hi, Community!

Please find a new session recording from Global Summit 2017:

An InterSystems Guide to the Data Galaxy

https://www.youtube.com/embed/cudBxwI1xTA
[This is an embedded link, but you cannot view embedded content directly on the site because you have declined the cookies necessary to access it. To view embedded content, you would need to accept all cookies in your Cookies Settings]

2 0
0 270

Hi Developers,

The new video from Global Summit 2019 is available on InterSystems Developers YouTube:

Introducing Analytic Workflows

https://www.youtube.com/embed/i32l5ayptaQ
[This is an embedded link, but you cannot view embedded content directly on the site because you have declined the cookies necessary to access it. To view embedded content, you would need to accept all cookies in your Cookies Settings]

2 0
0 278
Article
· Jan 14, 2022 1m read
Real Webserver Logs Dataset

I'm happy to share with the community a web server log dataset from our longtime customer, an operating company.

Their webserver operates on Apache webserver and contains data which can be useful to analyse a load and search engines activity.

After installing the project, you will get the data for a few months that can show a typical load and activity of clients, robots and also you can see how it depends on day of week, holidays and time of a day.

The Cube is also included in package.

2 0
0 603

As said in the previous article about the iris-fhir-generative-ai experiment, the project logs all events for analysis. Here we are going to discuss two types of analysis covered by analytics embedded in the project:

2 0
1 262
Article
· Dec 31, 2019 3m read
Portlets that use data from DeepSee


In the previous part of this series, we saw how to reference a web page that will enhance our dashboard experience. Now we will look into referencing data that is already in our cubes.

In this example, we will be referencing the controller object and we will be extracting data from it. This data will then be displayed as text in our Dashboard. In Part 5, we will show how to incorporate this data into other charting libraries.

2 0
0 267
Announcement
· Sep 12, 2019
Python Gateway 0.8 release

I'm happy to announce the latest Python Gateway release.

This is not an InterSystems product, it is community supported open source project.

Download new release from GitHub.

Now for the new features.

Fast transfer. Pass globals, classes and tables from InterSystems IRIS to Python with ease and speed (10x faster than old QueryExecute). Documentation.

2 8
0 527

Hi Community!

Enjoy watching the new video on InterSystems Developers YouTube:

Introduction to InterSystems Reports

https://www.youtube.com/embed/-AdK9sOwk50
[This is an embedded link, but you cannot view embedded content directly on the site because you have declined the cookies necessary to access it. To view embedded content, you would need to accept all cookies in your Cookies Settings]

2 0
0 242

With the release of InterSystems IRIS, we're also making available a nifty bit of software that allows you to get the best out of your InterSystems IRIS cluster when working with Apache Spark for data processing, machine learning and other data-heavy fun. Let's take a closer look at how we're making your life as a Data Scientist easier, as you're probably already facing tough big data challenges already, just from the influx of job offers in your inbox!

2 2
0 1.7K

Hi all,

I recently discovered the Monitoring Activity Volume feature in IRIS and I was amazed by it. So, I put it to work in one of our productions. It is nice how easy it is to set up and all the possibilites that came with it.

But there's something weird: the numbers. Actually, one of the BP is stating a time of more than 6 seconds to process:

2 6
1 386
Announcement
· Mar 16, 2017
Articles' Views Analytics

Hi, Community!

I hope you know the option to use DeepSee analytics portal for Developer Community stats. You can find it in Community-Analytics menu.

Let me introduce the beta of new analytical dashboard 'Articles' Views', which is available in Authors folder.

It consists of two dashboards, first shows the running total of the views for the articles (to see the impressive growing curve).

2 5
0 303

Hi, Community!

This is the 3rd part of DeepSee Web story - Angular base UI for DeepSee Dashboards, see the beginning here.

By design, DSW provides an implementation for every widget in DeepSee library. But there are some extra features in DSW which make solutions built with DSW dashboards more functional. This article describes it.

2 0
1 1K

Hey Community!

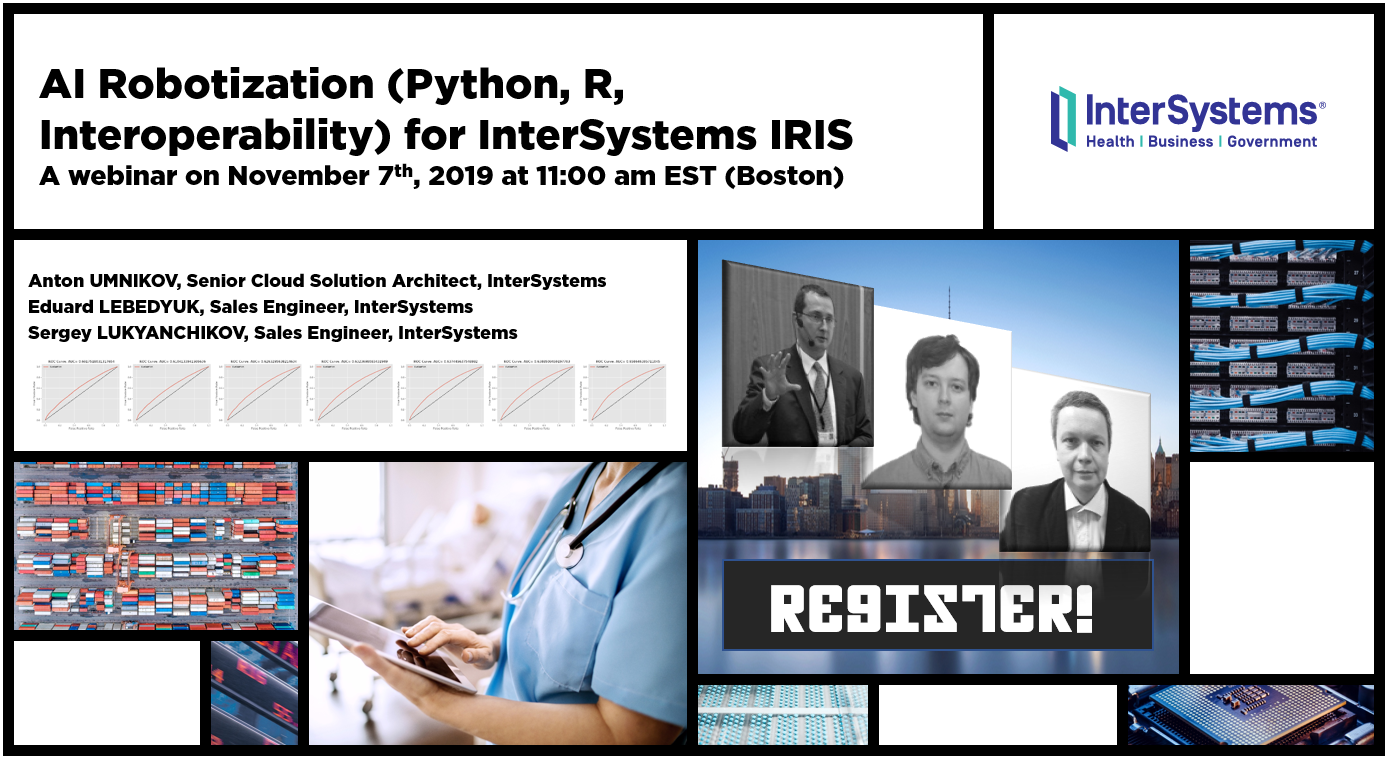
The latest webinar, recorded by InterSystems Sales Engineers @Sergey Lukyanchikov and @Eduard Lebedyuk, is already on InterSystems Developers YouTube! Please welcome:

"Machine Learning Toolkit (Python, ObjectScript, Interoperability, Analytics) for InterSystems IRIS"

https://www.youtube.com/embed/z9O0F1ovBUY
[This is an embedded link, but you cannot view embedded content directly on the site because you have declined the cookies necessary to access it. To view embedded content, you would need to accept all cookies in your Cookies Settings]

2 2
1 440

The InterSystems IRIS has a very nice container class to allows you have your Dashboards as classes source code. It is %DeepSee.UserLibrary.Container.

With this class is possible group all your dashboard and pivot table definitions.

This is useful to automatically create your dashboards when you build your docker project and other automation scenarios.

See:

2 4
1 265
Article
· Sep 9, 2022 1m read
DC Analytics Open Application

InterSystems Developer Community analytics. Project made with InterSystems IRIS BI (DeepSee), Power BI and Logi Report Designer to visualize and analyze members, articles, questions, answers, views and other pieces of content and activity on InterSystems Developer Community.

You can see your own activity, articles and questions. Track how your contribution changes developer community.

2 0
0 300

When analyzing data, there is often a need to look at specific indicators more thoroughly and to highlight sections of information of particular interest to a user.

For instance, examining the data dynamics for specific regions or dates can help us uncover some hidden trends and patterns that will allow us to make an informed decision about our project in the future.

2 0
1 407

Hi, Community!

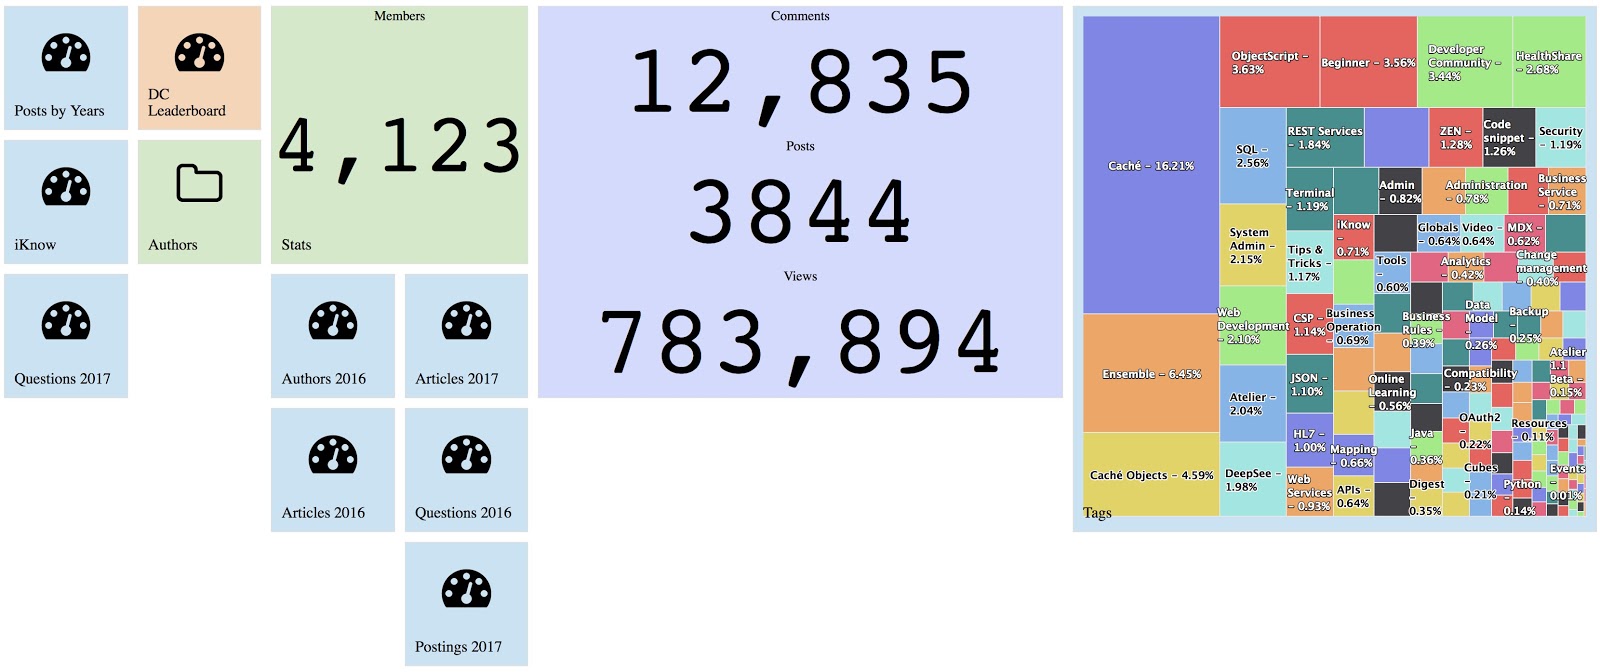
I’m sure you are using Developer Community analytics built with InterSystems Analytics technology DeepSee:

You can find DC analytics n InterSystems->Analytics menu.

DC Analytics shows interactive dashboards on key figures of DC entities: Posts, Comments, and Members.

Since the last week, this analytics project is available for everyone with source code and data on DC Github!

2 1
1 637

In the previous part of this series, we saw how to include data in a portlet from within DeepSee. This used the built in data controller. In this part, we are going to be pulling in data from outside of DeepSee. This will include both information from within InterSystems IRIS and from the OS.

Why use this?

This is useful if you would like to create a dashboard that only contains information about your system. It is also useful if you want to display data about your system along side data that you have stored in DeepSee.

2 0
0 358

Hi All, We have been using DeepSee which has been the integrated Analytic Dashboard built over Cache Cubes. It works fine but it's visual capabilities are limited and most probably is getting phased out. If I am not wrong, Tableau is the suggested alternative to DeepSee . It is expensive and a big and considerable shift from existing technology I wanted to get an opinion of the community as to these few key points - What other BI tools others have been using with IRIS and what have been their experience - For which tools are the best inbuilt support / api's avaialble in IRIS

2 10
0 610

Hi guys!

I'd like to present you my new project: iris-analytics-notebook, a notebook approach to use IRIS analytics capabilities.

Project description

In past few years, notebooks tools like Jupyter are gaining popularity due its natural way to express ideias.

An almost unipresent tool for data scientists, notebook can also help to improve the impact of analytics tools for all sort of users.

2 0
0 249

Hello InterSystems Community,

We're excited to announce that we've completed our first Open Exchange submission for InterSystems platforms.

BridgeWorks VDM is an ad hoc reporting and graphical SQL query builder application that was designed for any user who needs access to their SQL projections in InterSystems Caché, InterSystems IRIS, InterSystems IRIS for Health databases as well as access to InterSystems DeepSee and InterSystems IRIS BI Cubes with minimal SQL scripting experience.

VDM features:

2 0
1 514

Hi, Community!

This week we have two videos.

Please find the second Developer Community Video of the week on InterSystems Developers YouTube Channel:

Turning Accountants into Explorers

https://www.youtube.com/embed/2wG17vzXTy4
[This is an embedded link, but you cannot view embedded content directly on the site because you have declined the cookies necessary to access it. To view embedded content, you would need to accept all cookies in your Cookies Settings]

1 0
0 313

Hi Community,

New session recording from Global Summit 2019 is available on InterSystems Developers YouTube Channel:

The Data Management and Analytics Landscape

https://www.youtube.com/embed/wuuCQ6erMFs
[This is an embedded link, but you cannot view embedded content directly on the site because you have declined the cookies necessary to access it. To view embedded content, you would need to accept all cookies in your Cookies Settings]

1 0
0 193

Have you heard about some restrictions in cookies for tracking visitors to your sites?

One of our clients asked me about how to know really count of visitors.

Their site works on WordPress framework, hosted on classical NAMP hosting.

They can see some statistics from Yandex Metrika conter, but we was not sure about full coverage.

We gave him the AWStats, it takes data from Apache log files on hosting.

1 2
0 405