In an ever-changing world, companies must innovate to stay competitive. This ensures that they’ll make decisions with agility and safety, aiming for future results with greater accuracy.
Business Intelligence (BI) tools help companies make intelligent decisions instead of relying on trial and error. These intelligent decisions can make the difference between success and failure in the marketplace.
Microsoft Power BI is one of the industry’s leading business intelligence tools. With just a few clicks, Power BI makes it easy for managers and analysts to explore a company’s data. This is important because when data is easy to access and visualize, it’s much more like it’ll be used to make business decisions.


9 9
2 2.7K

Apache Spark has rapidly become one of the most exciting technologies for big data analytics and machine learning. Spark is a general data processing engine created for use in clustered computing environments. Its heart is the Resilient Distributed Dataset (RDD) which represents a distributed, fault tolerant, collection of data that can be operated on in parallel across the nodes of a cluster. Spark is implemented using a combination of Java and Scala and so comes as a library that can run on any JVM.

11 5
1 2.7K

There are several options how to deliver user interface(UI) for DeepSee BI solutions. The most common approaches are:

  • use native DeepSee Dashboards, get web UI in Zen and deliver it in your web apps.
  • use DeepSee REST API, get and build your own UI widgets and dashboards.

The 1st approach is good because of the possibility to build BI dashboards without coding relatively fast, but you are limited with preset widgets library which is expandable but with a lot of development efforts.

The 2nd provides you the way to use any comprehensive js framework (D3, Highcharts, etc) to visualize your DeepSee data, but you need to code widgets and dashboards on your own.

Today I want to tell you about yet another approach which combines both listed above and provides Angular based web UI for DeepSee Dashboards - DeepSee Web library.

3 16
5 2.3K

Keywords: PyODBC, unixODBC, IRIS, IntegratedML, Jupyter Notebook, Python 3

Purpose

A few months ago I touched on a brief note on "Python JDBC connection into IRIS", and since then I referred to it more frequently than my own scratchpad hidden deep in my PC. Hence, here comes up another 5-minute note on how to make "Python ODBC connection into IRIS".

1 0
1 2K

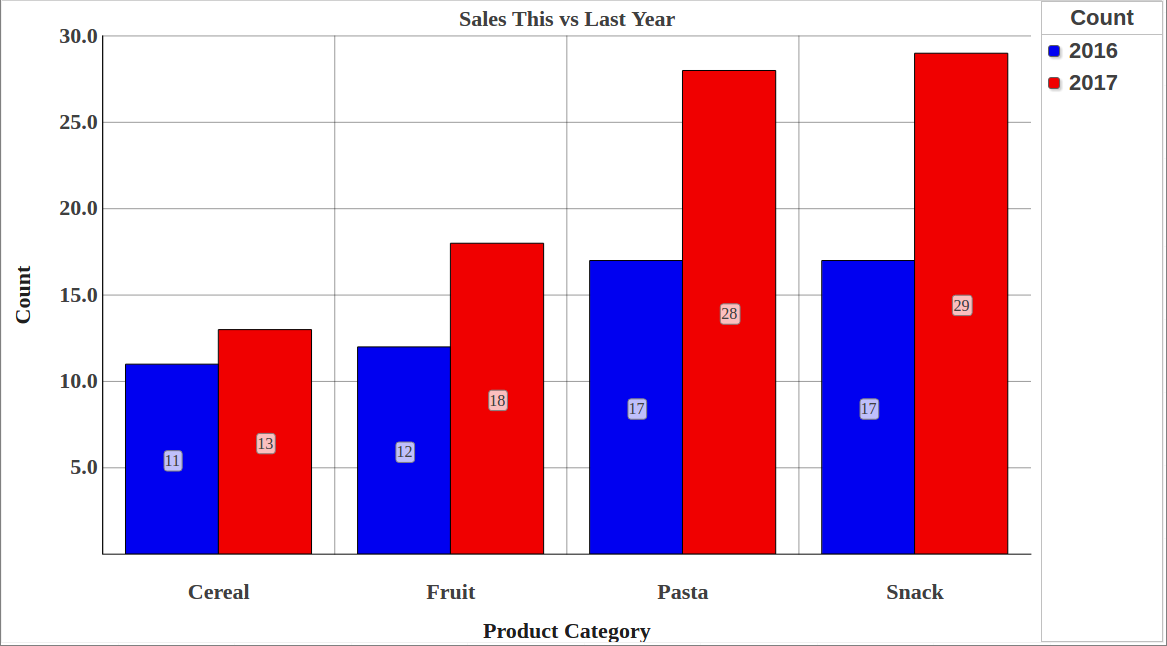
How are we doing THIS year versus the same period LAST year?
This is a common need in Business Intelligence. In fact, many design specifications for reports make use of a comparison between a selected period (year, quarter, etc) up to a certain date (for example November 15th, 2016) and a summary of the same information for the previous year (i.e. up to November 15th, 2015).
This post shows how to implement this in DeepSee.

6 8
0 1.8K

Last week, we announced the InterSystems IRIS Data Platform, our new and comprehensive platform for all your data endeavours, whether transactional, analytics or both. We've included many of the features our customers know and loved from Caché and Ensemble, but in this article we'll shed a little more light on one of the new capabilities of the platform: SQL Sharding, a powerful new feature in our scalability story.

13 11
1 1.5K

With the release of InterSystems IRIS, we're also making available a nifty bit of software that allows you to get the best out of your InterSystems IRIS cluster when working with Apache Spark for data processing, machine learning and other data-heavy fun. Let's take a closer look at how we're making your life as a Data Scientist easier, as you're probably already facing tough big data challenges already, just from the influx of job offers in your inbox!

2 2
0 1.6K

Our team has had success creating and publishing Power BI reports using an ODBC connection to an IRIS database, but there have been concerns about the responsiveness of these reports.

As an attempt to improve responsiveness, I'm trying out the "DirectQuery" connection using the InterSystems IRIS connector available in our version of Power BI Desktop (September 2021).

The version of IRIS I'm connecting with is "IRIS for Windows (x86-64) 2022.2"

0 3
0 1.5K

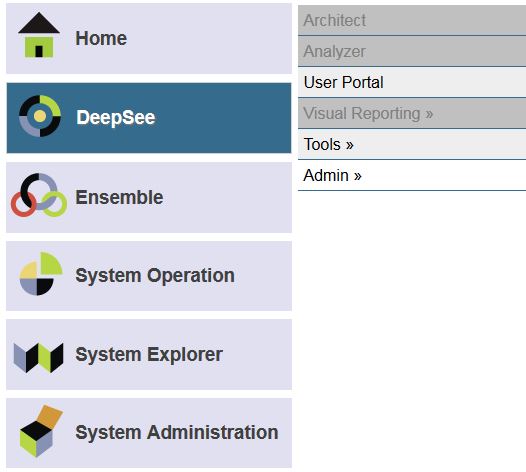
Whether you are accessing DeepSee for the first time ever or you are configuring DeepSee on a new instance, there are two common issues that are encountered after clicking on the “DeepSee” option in the System Management Portal.

Issue #1: Architect/Analyzer is grayed out!

Issue #2: DeepSee must be enabled before use.

Issue #1: Architect/Analyzer is grayed out!

There are two common causes for this problem.

5 1
0 1.5K
Article
· Jul 27, 2018 4m read
Load a ML model into InterSystems IRIS

Hi all. Today we are going to upload a ML model into IRIS Manager and test it.

Note: I have done the following on Ubuntu 18.04, Apache Zeppelin 0.8.0, Python 3.6.5.

Introduction

These days many available different tools for Data Mining enable you to develop predictive models and analyze the data you have with unprecedented ease. InterSystems IRIS Data Platform provide a stable foundation for your big data and fast data applications, providing interoperability with modern DataMining tools.

6 2
2 1.3K

System Monitor is a flexible and highly configurable tool supplied with Caché (Ensemble, HealthShare), which collects the essential metrics of the operating system and Caché itself. System Monitor also notifies administrators about issues with Caché and the operating system, when one or several parameters reach the admin-defined thresholds.

1 2
2 1.3K

Over the last couple of weeks the Solution Architecture team has been working to finish off our 2019 workload: this included open-sourcing the Readmission Demo that was brought to HIMSS last year, so we could make it available to anyone looking for an interactive-way of exploring the tooling provided by IRIS.

11 2
1 1.3K

Hi colleagues!

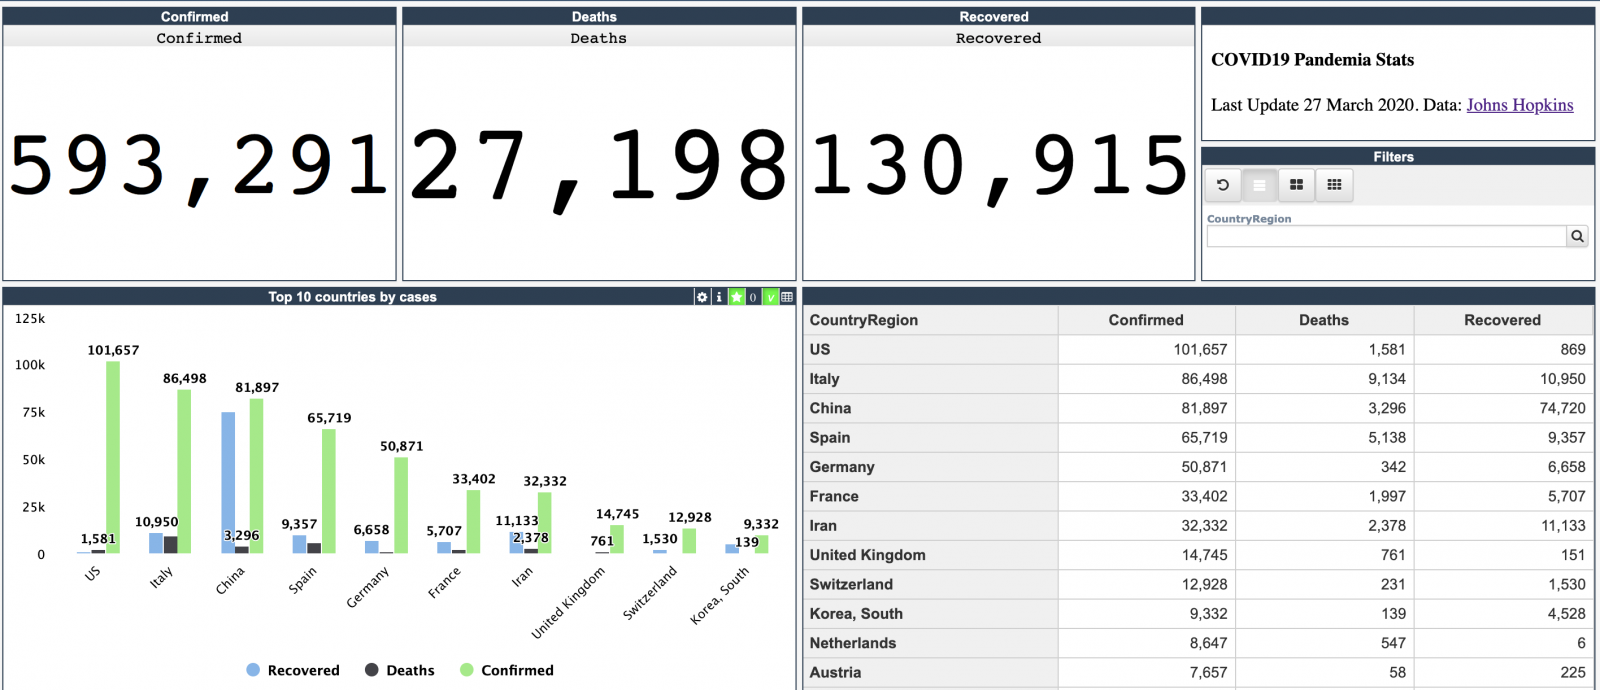
Every day Johns Hopkins University publishes new data on coronavirus COVID-19 pandemic status.

I built a simple InterSystems IRIS Analytics dashboard using InterSystems IRIS Community Edition in docker deployed on GCP Kubernetes which shows key measures of the disease outbreak.

This dashboard is an example of how information from CSV could be analyzed with IRIS Analytics and deployed to GCP Kubernetes in a form of InterSystems IRIS Community Edition.

Added the interactive map of the USA:

19 13
3 989
Announcement
· May 21, 2018
How is your code health

As a developer, usually I'm concerned about how my code health is, and how the other coders code can affect to my own work. And I'm quite sure most of us feel very similar.

In our company we use a Static Code Analysis tool to analyze code for different languages to ensure we are writing high quality and easily maintainable code by following a few best practices in terms of code structure and content. And the question was: why should be different for Caché ObjectScript language?

6 3
4 1.1K

In this article you will have access to the curated base of articles from the InterSystems Developer Community of the most relevant topics to learning InterSystems IRIS. Find top published articles ranked by Machine Learning, Embedded Python, JSON, API and REST Applications, Manage and Configure InterSystems Environments, Docker and Cloud, VSCode, SQL, Analytics/BI, Globals, Security, DevOps, Interoperability, Native API. Learn and Enjoy!

10 6
7 927

Now available on Open Exchange is a library of third party charts available to use within DeepSee/InterSystems IRIS BI dashboards. To start, simply download and install, select the new portlet as the widget type, then select the chart type that you desire. If you don't find the type of chart you are looking for, you can easily extend the portlet to implement your desired chart type. These new chart types can be used within existing dashboards or you can create new dashboards using them.

4 0
0 993
Article
· Mar 2, 2020 2m read
SQL -99 error while viewing a listing

This error is sometimes seen while viewing a listing in InterSystems IRIS Business Intelligence:
ERROR #5540: SQLCODE: -99 Message: User <USERNAME> is not privileged for the operation (4)

As the error suggests, this is due to a permission error. To figure out which permissions are missing/needed, we can take a look at the SQL query that is generated. We will use a query from SAMPLES as an example.

1 0
0 963

Hi,

As we announced at our Global Summit in October, we are developing dedicated connectors for a number of third-party data visualization tools for InterSystems IRIS. With these connectors, we want to combine an excellent user experience with optimal performance when using those tools to visualize data managed on InterSystems IRIS Data Platform.

1 3
0 900

I was using PowerBI to create regular display data obtained from one popular web sourse with hundreds of thousands of visitors per month and a big number of users.

At the beginning of that visualisation development, I was using direct connection from Power BI to Adaptive Analytics powered by AtScale. Adaptive Analytics is useful for cached data, aggregates and fast data sources switching between development and stage phases. The “AtScale cubes'' connection method was used:

3 0
0 904

Hi, Community!

This is the 3rd part of DeepSee Web story - Angular base UI for DeepSee Dashboards, see the beginning here.

By design, DSW provides an implementation for every widget in DeepSee library. But there are some extra features in DSW which make solutions built with DSW dashboards more functional. This article describes it.

2 0
1 876
Article
· Oct 19, 2022 3m read
Ingestion and Querying Speed Test

The capacity of taking numerous records every second while also facilitating real-time queries simultaneously in real time is called Hybrid Transactional Analytical Processing (HTAP). It is also called Transactional analytics or Transanalytics or Translytics and is a very useful element in scenarios where there is constant flow of real time data coming from IIOT sensors or data on fluctuations in stock market, and supporting the need for querying these data sets in real-time or near real-time.

4 4
0 785