My experience using the old method of connecting Power BI to Adaptive Analytics powered by AtScale.
I was using PowerBI to create regular display data obtained from one popular web sourse with hundreds of thousands of visitors per month and a big number of users.
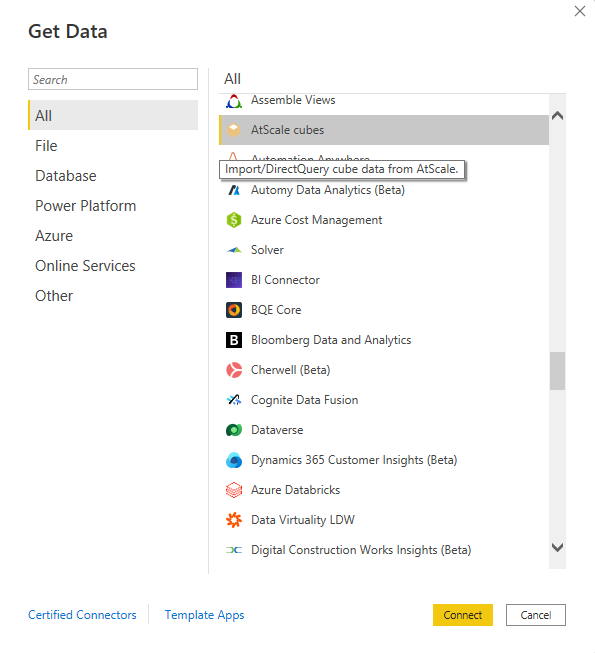
At the beginning of that visualisation development, I was using direct connection from Power BI to Adaptive Analytics powered by AtScale. Adaptive Analytics is useful for cached data, aggregates and fast data sources switching between development and stage phases. The “AtScale cubes'' connection method was used:
The Problem
Power BI is an enormously popular business intelligence platform with rich visualization and reporting capabilities employed by large and small organizations. One of the many challenges that the platform has been facing was delivering a performant live query experience for users. Power BI users typically rely on either local “Imports” of cloud data or «DirectQuery» mode that suffers from rendering-based performance challenges.
The Solution
AtScale collaborated with Microsoft to introduce native DAX connectivity which enables Power BI to leverage Live Query connections through AtScale to common cloud data platforms including Microsoft Azure Synapse, Google BigQuery, Snowflake, Amazon Redshift, and Databricks. This joint solution ensures high performance rendering on Power BI and highly performant queries to cloud data. AtScale is the only solution that supports Live Query connectivity to cloud data.
If a fact dataset uses inner joins to connect to more than one dimension, the AtScale engine can generate demand-defined aggregates that include data from those dimensions. You can also determine your own aggregate-table definitions that use inner joins.
Joins can be extremely expensive when tables have a large number of rows. For this reason, the AtScale engine will build aggregates for fact datasets with a join to one or more dimensions only if the compression ratio is higher compared to an aggregate that does not use a join. The compression ratio is the number of rows in the fact dataset relative to the number of rows in a proposed aggregate.
For example, suppose that a fact dataset has a billion rows and contains an attribute named Customer Key. This key is used joins with the Customer dimension, which has one million rows. A query to the fact dataset requests Order Quantity by Customer Name. An aggregate table based on this query would contain one million rows versus the billion rows in the fact dataset. Therefore, since the compression is 1000x, the AtScale engine would create an aggregate.
There are two ways to connect Power BI to AtScale:
- Microsoft's SQL Server Analysis Services Database Connector - the state-of-the-art method of connecting to AtScale that overcomes most of the limitations of the Microsoft "AtScale Cubes" Connector. It requires AtScale 2020.5.2, AtScale 2021.2.0 or later versions. This method requires setting up Authorization in Microsoft style. For example, Microsoft Active Directory of Microsoft Azure AD deployed in the Cloud with allowed permissions for users from AD authorized in Power BI Desktop or Power BI Portal granting access to Adaptive Analytics running instance. This big task to make them work together is hard enough.
- Microsoft's AtScale Cubes Connector - The previously preferred method of connecting Power BI to AtScale. This method of connection is deprecated as of AtScale 2020.5.2. It is a simple login and password authorization method that works just after installation. We can use regular users' logins from Adaptive Analytics to authorize Power BI desktop and Power BI in the Cloud. It looks fine at the beginning. The Power BI Scheduler can update the data periodically.
At first glance, it seems to be a good idea to use the second, more simple connection method. However, keep on reading, and the article will reveal its reasons against doing that.
Quick Notes from the Adaptive Analytics and Power BI instructions:
- Starting from AtScale 2020.5.2, the "AtScale Cubes" connector has become outdated and will no longer be maintained by Microsoft. It is strongly recommended that customers install a compatible version of AtScale and migrate to using the SQL Server Analysis Services Database Connector.
- The "SQL Server Analysis Services Database Connector" is not supported by AtScale 2021.1.0. It is supported by AtScale 2020.5.2, AtScale 2021.2.0 and later versions.
The method that we used is obsolete and not relevant. Officially, it is considered deprecated and removed from support.
Because of that, the method has very little functionality. It is suitable for simple data visualization only.
The disadvantages of this connection include:
- You cannot change the data type of the fields. There is a date in the Mon-YYYY (Jan-2022) format. This parameter is defined as a string, so you need to sort this date according to the calendar. However, since you cannot change the data type, this field will be sorted alphabetically.
- We cannot create calculated fields. We cannot use DAX - expressions or formulas for data analysis. These expressions are a combination of functions, operators, and constants that are evaluated as a single formula to produce results. DAX can only be used in measures.
- Ability to connect only one cube per project. In AtScale, you can create an unlimited number of cubes in a project. Yet, using the legacy connection method, you can only connect one cube from a project without the ability to change it in the future.
- The Only Data Source is the AtScale cube. Also, we cannot add new different data sources in Power BI after connecting the AtScale cube. The option of GetData is simply disabled in the ribbon buttons on the Panel of Power BI. It looks like the Power BI starts using a special driver, and no other driver can handle data inside of that book.
- Error when scrolling a table or filter for a long time. When a table or filter is being scrolled for a long time, it throws an error. Most likely, it is a bug that was not fixed due to an outdated connection method.
Benefits of this method:
- Easy connection to AtScale. To connect, you just need an MDX URL and a login with a password. Then you can select the desired cube and start working.
- A simple use for building dashboards. All fields are collected in a structured way. It is difficult to get confused in those fields.
Conclusion
The lack of most features greatly limits the capabilities of Power BI. From personal experience, I encountered a lack of possibilities for changing the data type. For example, it is necessary to sort the table by the date of the mm-yyyy format. According to the standard of AtScale, this is a text format, which is why it is sorted alphabetically and not by date. The second trouble I had in a real dashboard was an error when scrolling a long table or filter. When there is a large data set, you need to get to a certain value in the filter, and then it throws an error.
I hope you will stumble upon this article before connecting your Adaptive Analytics to the Power BI dashboard, so you will still be able to select which method to use in your project. Also, I expect that this article will save you some hours of a lifetime because the selected method of connection cannot be changed in future, and once connected your dashboard will always stick to the old connection method.
So thank you for reading. Remember to pay attention to those things and look for my future articles where I will describe how I connect Power BI to Adaptive Analytics using a new method that simulates SQL Server Analysis Services and should bypass all the problems described above.