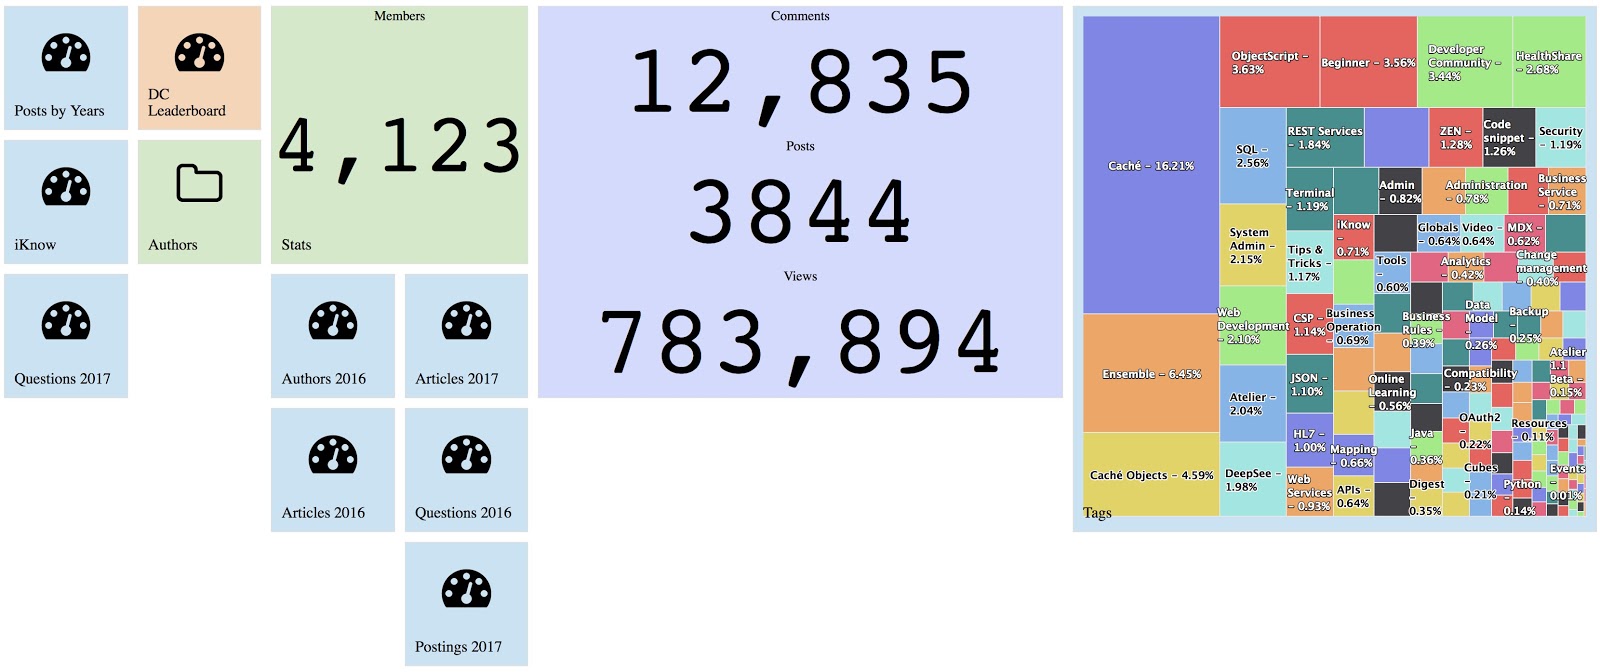
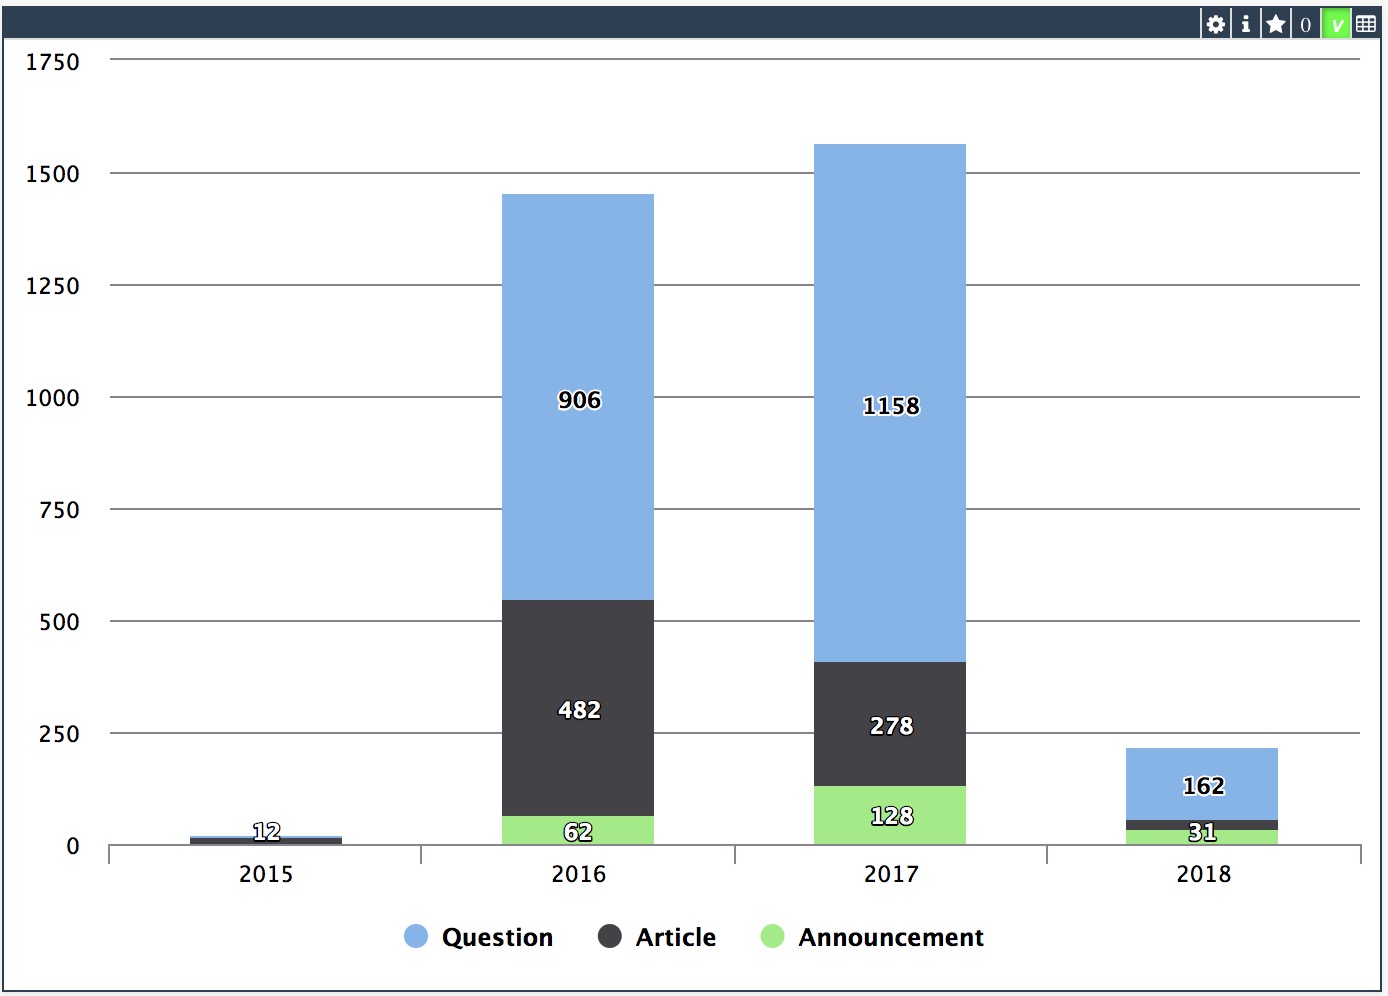
This tag relates to the discussions on the development of analytics and business intelligence solutions, visualization, KPI and other business metrics management.
With the release of InterSystems IRIS, we're also making available a nifty bit of software that allows you to get the best out of your InterSystems IRIS cluster when working with Apache Spark for data processing, machine learning and other data-heavy fun. Let's take a closer look at how we're making your life as a Data Scientist easier, as you're probably already facing tough big data challenges already, just from the influx of job offers in your inbox!
Apache Spark has rapidly become one of the most exciting technologies for big data analytics and machine learning. Spark is a general data processing engine created for use in clustered computing environments. Its heart is the Resilient Distributed Dataset (RDD) which represents a distributed, fault tolerant, collection of data that can be operated on in parallel across the nodes of a cluster. Spark is implemented using a combination of Java and Scala and so comes as a library that can run on any JVM.
The following post is a guide to implement a basic architecture for DeepSee. This implementation includes a database for the DeepSee cache and a database for the DeepSee implementation and settings.
https://www.youtube.com/embed/E3o87dMxamE [This is an embedded link, but you cannot view embedded content directly on the site because you have declined the cookies necessary to access it. To view embedded content, you would need to accept all cookies in your Cookies Settings]
By design, DSW provides an implementation for every widget in DeepSee library. But there are some extra features in DSW which make solutions built with DSW dashboards more functional. This article describes it.
Last week, we announced the InterSystems IRIS Data Platform, our new and comprehensive platform for all your data endeavours, whether transactional, analytics or both. We've included many of the features our customers know and loved from Caché and Ensemble, but in this article we'll shed a little more light on one of the new capabilities of the platform: SQL Sharding, a powerful new feature in our scalability story.
At this year’s Global Summit, InterSystems debuted InterSystems IRIS Data Platform™, a single, comprehensive product that provides capabilities spanning data management, interoperability, transaction processing, and analytics. InterSystems IRIS sets a new level of performance for the rapid development and deployment of data-rich and mission-critical applications. Now is your chance to learn more!
I'm trying to immigrate some of my HealthInsight dashboards and pivot tables to another HS instance.
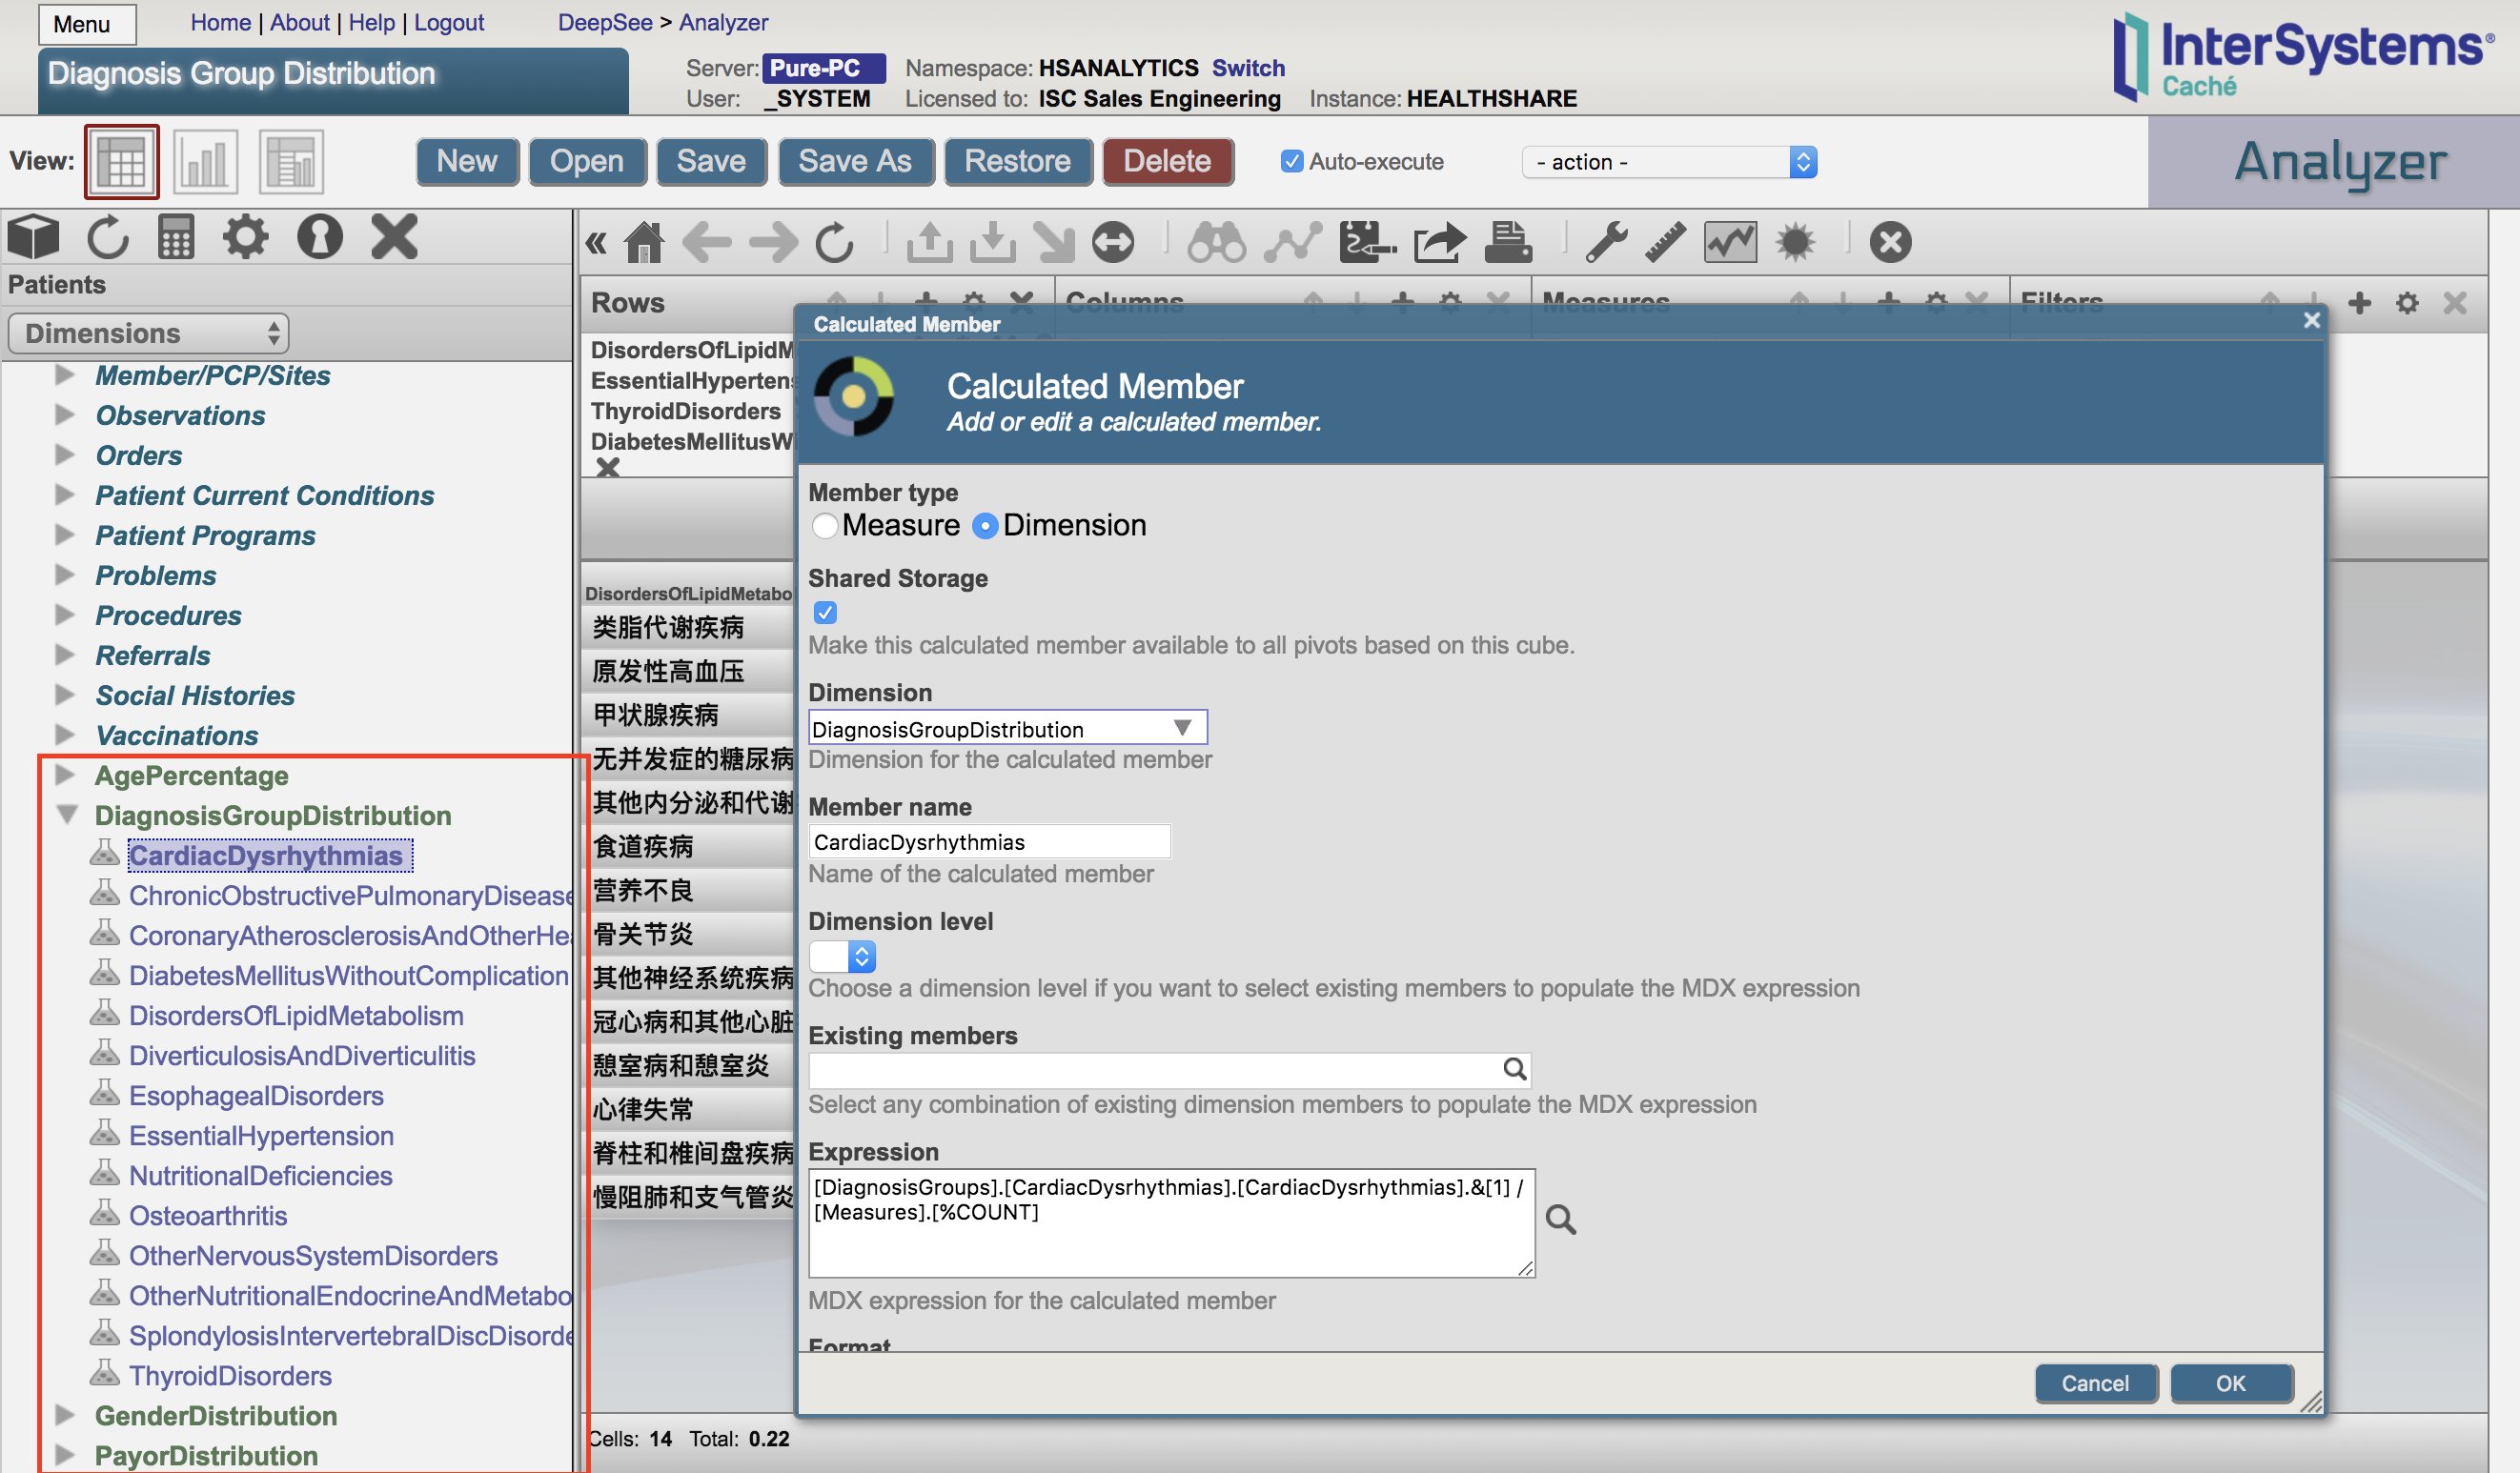
In some pivot tables, I defined them with a set of calculated dimensions defined in the analyzer, e.g as below:
Then when I exported the cubes and pivot tables in used to my new envirmonment. When I open my pivot tables again, the calculated dimensions are missing and hence my pivot tables no longer work:
https://www.youtube.com/embed/cudBxwI1xTA [This is an embedded link, but you cannot view embedded content directly on the site because you have declined the cookies necessary to access it. To view embedded content, you would need to accept all cookies in your Cookies Settings]
I have a persistent class “sp.SensorReading” which has a number of Properties: Date, SensorName, SensorReading. (sometimes multiple readings from the same sensor, on a given day)
... Temp 28 Jan 33.5 Temp 29 Jan 31.2 Temp 30 Jan 33.1 Temp 30 Jan 34.1 Temp 31 Jan 32.1 Temp 31 Jan 33.1
System Monitor is a flexible and highly configurable tool supplied with Caché (Ensemble, HealthShare), which collects the essential metrics of the operating system and Caché itself. System Monitor also notifies administrators about issues with Caché and the operating system, when one or several parameters reach the admin-defined thresholds.
Has anyone ever estimated the amount of disk space consumed by the iKnow indexing process ? I know this will be a rough estimate, but, I imagine that for sizing purposes, that would be enough.
The language the unstructured text is in is English.
https://www.youtube.com/embed/2wG17vzXTy4 [This is an embedded link, but you cannot view embedded content directly on the site because you have declined the cookies necessary to access it. To view embedded content, you would need to accept all cookies in your Cookies Settings]
I have a series of data organized by time (year and month) so I can use a time dimension to drill down data. So far so good.
However, I need to display the data not by calendar years and months but rather by seasons. The season has 12 calendar months but starts in September. So I'd like to see the data from September / Year N to August / Year N+1 using the same hierarchy as normal time dimension.
Has anyone done something similar?
Obviously, the season can start by any month, not only September :)
The Data Platforms department here at InterSystems is gearing up for this year's crop of interns, and I for one am very excited to meet them all next week!
We've got folks from top technical colleges with diverse specialties from hard core engineers to pure computer scientists to mathematicians to business professionals. They come from countries around the world like Vietnam, China, and Finland and they all come with impressive backgrounds. We're sure they will do very well this summer.
I was wondering if InterSystems offers any message profiling capabilities. What I mean by "message profiling" is essentially stats or metrics gathered from a collection of data submissions of a particular type. For instance, average number of segments <XYZ> in a specific HL7 V2 message type. Or the number of sections found in a HL7 V3 CDA documents.
Curious if there is anything like this provided "out-of-box".
The >/</= etc. operands in named filters are great... except they won't work with measures ('native' or calculated - and what a boon it would be if they could work with both).
Are there any plans to add this capability?
And are there any plans to have a 'named filter' control within widgets that would let you change the operand?
Back in my COBOL days, there was a utility that would analyze running COBOL code and expose bottle necks and those modules that were inefficient or were executed multiple times. This was to help the programmer know where to concentrate streamlining efforts.
How are we doing THIS year versus the same period LAST year? This is a common need in Business Intelligence. In fact, many design specifications for reports make use of a comparison between a selected period (year, quarter, etc) up to a certain date (for example November 15th, 2016) and a summary of the same information for the previous year (i.e. up to November 15th, 2015). This post shows how to implement this in DeepSee.
My group and I are currently doing a research project on natural language processing and iKnow plays a big role in this project. I am aware that the algorithms iKnow use aren't public, and I respect that.
My question is, are there any public documents/research that explains, at least part of, the algorthims iKnow uses and the motivations for using them?
I am trying to create a query that returns the best and worst performing products for a given customer, based on this year's net sales versus last year's net sales, weighted by the total net sales for all of the products sold to this customer in the last two years.
I have created Last Year Net Sales (up to the last month end): AGGREGATE(PERIODSTODATE([Invoice Date].[H1].[YEAR],[Invoice Date].[H1].[Month].[NOW-13]),measures.[Net Sales])
In DeepSee we have a field that is numeric but is used as a dimension. In DeepSee it sorts this field in the following order. 10, 11, 15, 2, 3, 5, 6, 8, 990. Is there a way to have DeepSee sort it numerically instead of treating it like a character field? We would want to see it show up in the dimension as 2,3,5,6,7,10,11,15,990.
Whether you are accessing DeepSee for the first time ever or you are configuring DeepSee on a new instance, there are two common issues that are encountered after clicking on the “DeepSee” option in the System Management Portal.
I've asked a lot of questions leading up to this, so I wanted to share some of my progress.
The blue line represents the number of messages processed. The background color represents the average response time. You can see ticks for each hour (and bigger ticks for each day). Hovering over any point in the graph will show you the numbers for that period in time.
This is super useful for "at a glance" performance monitoring as well as establishing patterns in our utilization.
This article contains the tutorial document for a Global Summit academy session on Text Categorization and provides a helpful starting point to learn about Text Categorization and how iKnow can help you to implement Text Categorization models. This document was originally prepared by Kerry Kirkham and Max Vershinin and should work based on the sample data provided in the SAMPLES namespace.