Hi everyone,
I'm creating something to test the Analytics capabilities.
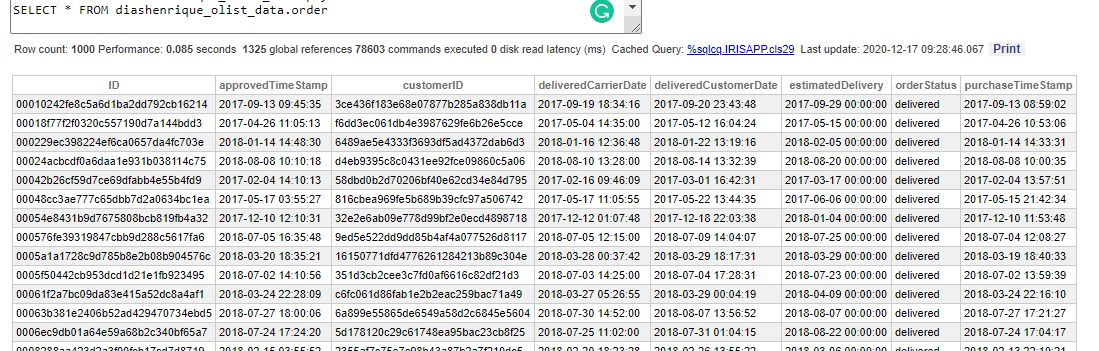
I have a table with 100k records. Consulting the data using ^%G or SELECT, everything is working fine.
But, when I create a Cube using this same class as Source, the Build results in only 1 fact.
I would like to know if anyone else faces the same situation before and have some guidance.
Some details:
Class diashenrique.olist.data.order Extends %Persistent
{

Property customerID As diashenrique.olist.data.customer;

Property orderStatus As %String;

Property purchaseTimeStamp As %TimeStamp;

Property approvedTimeStamp As %TimeStamp;

Property deliveredCarrierDate As %TimeStamp;

Property deliveredCustomerDate As %TimeStamp;

Property estimatedDelivery As %TimeStamp;

Index OrderStatusIndex On orderStatus;

Index customerIndex On customerID;

Index purchaseIndex On purchaseTimeStamp;

Storage Default
{
<Data name="orderDefaultData">
<Value name="1">
<Value>%%CLASSNAME</Value>
</Value>
<Value name="2">
<Value>customerID</Value>
</Value>
<Value name="3">
<Value>orderStatus</Value>
</Value>
<Value name="4">
<Value>purchaseTimeStamp</Value>
</Value>
<Value name="5">
<Value>approvedTimeStamp</Value>
</Value>
<Value name="6">
<Value>deliveredCarrierDate</Value>
</Value>
<Value name="7">
<Value>deliveredCustomerDate</Value>
</Value>
<Value name="8">
<Value>estimatedDelivery</Value>
</Value>
</Data>
<DataLocation>^orderD</DataLocation>
<DefaultData>orderDefaultData</DefaultData>
<IdLocation>^orderD</IdLocation>
<IndexLocation>^orderI</IndexLocation>
<StreamLocation>^orderS</StreamLocation>
<Type>%Storage.Persistent</Type>
}

}


.png)