This tag relates to the discussions on the development of analytics and business intelligence solutions, visualization, KPI and other business metrics management.
Do you want to reap the benefits of the advances in the fields of artificial intelligence and machine learning? With InterSystems IRIS and the Machine Learning (ML) Toolkit it’s easier than ever.
Join InterSystems Sales Engineers, @Sergey Lukyanchikovand @Eduard Lebedyuk, for the Machine Learning Toolkit for InterSystems IRIS webinar on Tuesday, April 23rd at 11 a.m. EDT to find out how InterSystems IRIS can be used as both a standalone development platform and an orchestration tool for predictive modelling that helps stitch together Python and other external tools.
https://www.youtube.com/embed/PQqfrxIYMoc [This is an embedded link, but you cannot view embedded content directly on the site because you have declined the cookies necessary to access it. To view embedded content, you would need to accept all cookies in your Cookies Settings]
AnalyzeThis is a tool for getting a personalized preview of your own data inside of InterSystems BI. This allows you to get first hand experience with InterSystems BI and understand the power and value it can bring to your organization. In addition to getting a personalized preview of InterSystems BI through an import of a CSV file with your data, Classes and SQL Queries are now supported as Data Sources in v1.1.0!
Running predictive models natively in an InterSystems IRIS Business Process has of course always been the goal of our PMML support, but somehow never made it into the kit because there were a few dependencies and choices that needed addressing and answering. Anyhow, thanks to some pushing and code kindly provided by @Amir Samary (Thanks again Amir!), we finally got it wrapped in a GitHub repo for your enjoyment, review and suggestions.
As we announced at our Global Summit in October, we are developing dedicated connectors for a number of third-party data visualization tools for InterSystems IRIS. With these connectors, we want to combine an excellent user experience with optimal performance when using those tools to visualize data managed on InterSystems IRIS Data Platform.
Easily transform a CSV file into a personalized preview of DeepSee - InterSystems BI
AnalyzeThis can be found on InterSystems Open Exchange. Use the Download link to navigate to GitHub and begin installing the project. Follow the “Installation” section of the GitHub README.
https://www.youtube.com/embed/ZGYIdCTEqoQ [This is an embedded link, but you cannot view embedded content directly on the site because you have declined the cookies necessary to access it. To view embedded content, you would need to accept all cookies in your Cookies Settings]
I asked previously about the DR server in the cloud but actually, I'm curious about the backup server to use as analytics server more than for recovery in DR case.
There is a recommended practice to use an async mirror as a server for BI (InterSystems Analytics, DeepSee)
The question is if I have PRIMARY in the cloud (AWS, Google, Azure, etc) "how far" should async mirror member be placed? Same cloud, same private cloud or it doesn't matter at all for analytics purposes?
Hello,
I need help in health insight. I am trying to generate reports on deep see but i am not able to pull in the patient ids as these are our requirements for the project. Can anyone help me in unlocking this feature.
Can anyone help me with link to correct documentation on how to access the edge gateways of multiple facilities to access the clinical data on sql explorer.
Users of analytical applications often need to generate and send out PDF reports comprised of elements of the analytical panel. In the InterSystems stack, this task is solved using the DSW Reports project that is an extension of DeepSeeWeb. In this article, we will explain how to use DSW Reports for generating PDF reports and emailing them.
The row expression defines what dimensions and measures appear on the rows of your pivot table as well as how they appear. Sets and CROSSJOINs are used.
We’re now less than a month away from our annual conference, the InterSystems Global Summit. This year, we’ll be descending on the beautiful outskirts of San Antonio, a city worth visiting for its wonderful river walkway and its 18th century Spanish Mission, even if it hadn’t been the location of this year’s InterSystems event. Leaving the tourist guidance to the tourist guides, let’s take a closer look at what the conference has in stock for you, including a dedicated post-summit symposium on AI and ML on Wednesday October 3!
The source class of a DeepSee cube has a property referencing a different class:
Class ClassA Extends %Persistent {
     Property P1 As ClassB;
}
When records in class B change, the ^OBJ.DSTIME global for Class A will not be automatically updated. This means that synchronization of cubes based on source class A will not reflect the changes occurred to property P1. This post will help you determine the best way to achieve synchronization of properties referencing a different class
Hi all. Today we are going to upload a ML model into IRIS Manager and test it.
Note: I have done the following on Ubuntu 18.04, Apache Zeppelin 0.8.0, Python 3.6.5.
Introduction
These days many available different tools for Data Mining enable you to develop predictive models and analyze the data you have with unprecedented ease. InterSystems IRIS Data Platform provide a stable foundation for your big data and fast data applications, providing interoperability with modern DataMining tools.
I was approached recently by and end use who wanted to perform analysis of their databases and see how they could save some space by picking data good for deletion without harming the application. As part of investigation, they wanted to know sizes of globals within datasets. This can be achieved by various means but all of them provide data in text form only.
I thought I might be a good tool for database administrators in general - to see global sizes in a graphical way.
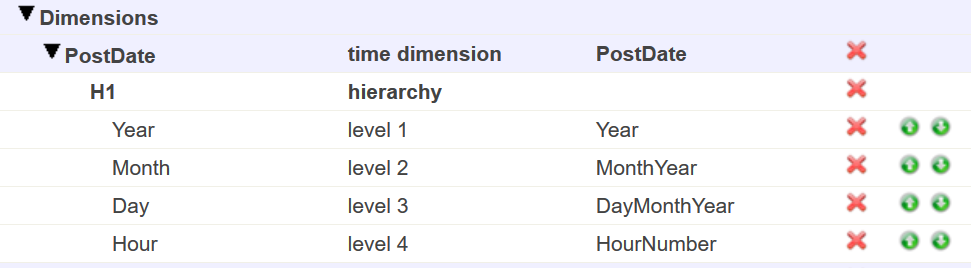
I have a server with rusw locale but in my cube the time dimension shows dates such as "JAN-2018". Is there a way to either localize that (preferably) or just output numbers like "01-2018"?
Architect:
Analyzer:
Also in architect, in level settings there is a "Time Format" property, what's that? Tried setting it to 3 but it didn't help.
As a developer, usually I'm concerned about how my code health is, and how the other coders code can affect to my own work. And I'm quite sure most of us feel very similar.
In our company we use a Static Code Analysis tool to analyze code for different languages to ensure we are writing high quality and easily maintainable code by following a few best practices in terms of code structure and content. And the question was: why should be different for Caché ObjectScript language?
The following post outlines a more flexible architectural design for DeepSee. As in the previous example, this implementation includes separate databases for storing the DeepSee cache, DeepSee implementation and settings, and synchronization globals. This example introduces one new databases to store the DeepSee indices. We will redefine the global mappings so that the DeepSee indices are not mapped together with the fact and dimension tables.
The following post outlines an architectural design of intermediate complexity for DeepSee. As in the previous example, this implementation includes separate databases for storing the DeepSee cache, DeepSee implementation and settings. This post introduces two new databases: the first to store the globals needed for synchronization, the second to store fact tables and indices.
The following post is a guide to implement a basic architecture for DeepSee. This implementation includes a database for the DeepSee cache and a database for the DeepSee implementation and settings.
I am planning to implement Business Intelligence based on the data in my instances. What is the best way to set up my databases and environment to use DeepSee?
https://www.youtube.com/embed/E3o87dMxamE [This is an embedded link, but you cannot view embedded content directly on the site because you have declined the cookies necessary to access it. To view embedded content, you would need to accept all cookies in your Cookies Settings]
 By date