This tag relates to the discussions on the development of analytics and business intelligence solutions, visualization, KPI and other business metrics management.
https://www.youtube.com/embed/-OwOAHC5b3s [This is an embedded link, but you cannot view embedded content directly on the site because you have declined the cookies necessary to access it. To view embedded content, you would need to accept all cookies in your Cookies Settings]
I am looking for a reporting tool (Analytics purpose) which can be built using cache object script/MUMPS. Basically my requirement is to find a tool where I can implement cache code to report data for my application.
I am unaware of DeepSee and how it works. Please assist for the same.
As we announced at our Global Summit in October, we are developing dedicated connectors for a number of third-party data visualization tools for InterSystems IRIS. With these connectors, we want to combine an excellent user experience with optimal performance when using those tools to visualize data managed on InterSystems IRIS Data Platform.
As a developer, usually I'm concerned about how my code health is, and how the other coders code can affect to my own work. And I'm quite sure most of us feel very similar.
In our company we use a Static Code Analysis tool to analyze code for different languages to ensure we are writing high quality and easily maintainable code by following a few best practices in terms of code structure and content. And the question was: why should be different for Caché ObjectScript language?
Our team has had success creating and publishing Power BI reports using an ODBC connection to an IRIS database, but there have been concerns about the responsiveness of these reports.
As an attempt to improve responsiveness, I'm trying out the "DirectQuery" connection using the InterSystems IRIS connector available in our version of Power BI Desktop (September 2021).
The version of IRIS I'm connecting with is "IRIS for Windows (x86-64) 2022.2"
I work on an ERP system and am trying to set up a dashboard according to a customer request. It's a pivot table with a few controls and filters, nothing too difficult, but I'm having some issues with drill down.
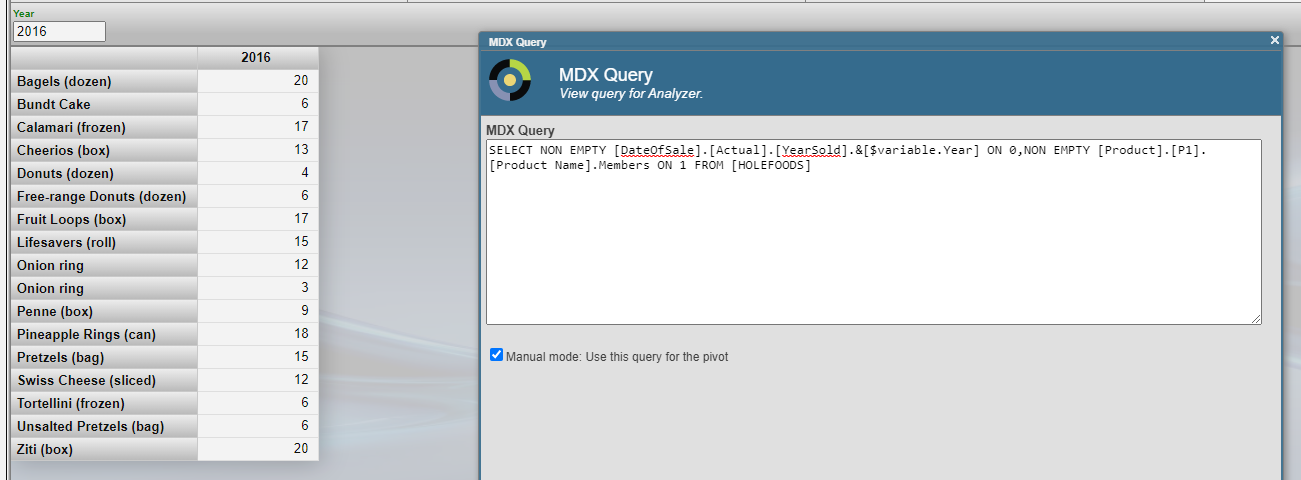
I am trying to create a query that returns the best and worst performing products for a given customer, based on this year's net sales versus last year's net sales, weighted by the total net sales for all of the products sold to this customer in the last two years.
I have created Last Year Net Sales (up to the last month end): AGGREGATE(PERIODSTODATE([Invoice Date].[H1].[YEAR],[Invoice Date].[H1].[Month].[NOW-13]),measures.[Net Sales])
How to include IRIS Data into your Google Big Query Data Warehouse and in your Data Studio data explorations. In this article we will be using Google Cloud Dataflow to connect to our InterSystems Cloud SQL Service and build a job to persist the results of an IRIS query in Big Query on an interval.
Today, is important analyze the content into portals and websites to get informed, analyze the concorrents, analyze trends, the richness and scope of content of websites. To do this, you can alocate people to read thousand of pages and spend much money or use a crawler to extract website content and execute NLP on it. You will get all necessary insights to analyze and make precise decisions in a few minutes.
Hello,
I need help in health insight. I am trying to generate reports on deep see but i am not able to pull in the patient ids as these are our requirements for the project. Can anyone help me in unlocking this feature.
Can anyone help me with link to correct documentation on how to access the edge gateways of multiple facilities to access the clinical data on sql explorer.
I asked previously about the DR server in the cloud but actually, I'm curious about the backup server to use as analytics server more than for recovery in DR case.
There is a recommended practice to use an async mirror as a server for BI (InterSystems Analytics, DeepSee)
The question is if I have PRIMARY in the cloud (AWS, Google, Azure, etc) "how far" should async mirror member be placed? Same cloud, same private cloud or it doesn't matter at all for analytics purposes?
I have a series of data organized by time (year and month) so I can use a time dimension to drill down data. So far so good.
However, I need to display the data not by calendar years and months but rather by seasons. The season has 12 calendar months but starts in September. So I'd like to see the data from September / Year N to August / Year N+1 using the same hierarchy as normal time dimension.
Has anyone done something similar?
Obviously, the season can start by any month, not only September :)
https://www.youtube.com/embed/MmrePiLBDac [This is an embedded link, but you cannot view embedded content directly on the site because you have declined the cookies necessary to access it. To view embedded content, you would need to accept all cookies in your Cookies Settings]
According to IDC, more than 80% of information it is NoSQL, especially text into documents. When the digital services or applications not process all this information, the business lose. To face this challenge, it is possible use OCR technology. OCR uses machine learning and/or trained image patterns to transform image pixels into text. This is important, because many documents are scanned into images inside PDF, or many documents contains images with text inside. So OCR are an important step to get all possible data from a document.
we are wondering if anybody has a reporting tool that is capable using IRIS Objects?
I know there are things like Crystal Reports and others out there who can read the SQL Data throug ODBC but we need the capability of using object methods while running the report.
Since now we where using a JAVA based report generator (ReportWeaver) but since the object binding for JAVA doesn't exist anymore in IRIS data platform, did any of you have an alternative report generator?
Over the last couple of weeks the Solution Architecture team has been working to finish off our 2019 workload: this included open-sourcing the Readmission Demo that was brought to HIMSS last year, so we could make it available to anyone looking for an interactive-way of exploring the tooling provided by IRIS.
I've asked a lot of questions leading up to this, so I wanted to share some of my progress.
The blue line represents the number of messages processed. The background color represents the average response time. You can see ticks for each hour (and bigger ticks for each day). Hovering over any point in the graph will show you the numbers for that period in time.
This is super useful for "at a glance" performance monitoring as well as establishing patterns in our utilization.
System Monitor is a flexible and highly configurable tool supplied with Caché (Ensemble, HealthShare), which collects the essential metrics of the operating system and Caché itself. System Monitor also notifies administrators about issues with Caché and the operating system, when one or several parameters reach the admin-defined thresholds.
Running predictive models natively in an InterSystems IRIS Business Process has of course always been the goal of our PMML support, but somehow never made it into the kit because there were a few dependencies and choices that needed addressing and answering. Anyhow, thanks to some pushing and code kindly provided by @Amir Samary (Thanks again Amir!), we finally got it wrapped in a GitHub repo for your enjoyment, review and suggestions.
 By replies
 Open Exchange app


.png)