Have you heard about some restrictions in cookies for tracking visitors to your sites?

One of our clients asked me about how to know really count of visitors.

Their site works on WordPress framework, hosted on classical NAMP hosting.

They can see some statistics from Yandex Metrika conter, but we was not sure about full coverage.

We gave him the AWStats, it takes data from Apache log files on hosting.

1 2
0 405

System Monitor is a flexible and highly configurable tool supplied with Caché (Ensemble, HealthShare), which collects the essential metrics of the operating system and Caché itself. System Monitor also notifies administrators about issues with Caché and the operating system, when one or several parameters reach the admin-defined thresholds.

1 2
2 1.4K

Running predictive models natively in an InterSystems IRIS Business Process has of course always been the goal of our PMML support, but somehow never made it into the kit because there were a few dependencies and choices that needed addressing and answering. Anyhow, thanks to some pushing and code kindly provided by @Amir Samary (Thanks again Amir!), we finally got it wrapped in a GitHub repo for your enjoyment, review and suggestions.

1 2
3 498

A few months ago, I read this interesting article from MIT Technology Review, explaing how COVID-19 pandemic are issuing challenges to IT teams worldwide regarding their machine learning (ML) systems.

Such article inspire me to think about how to deal with performance issues after a ML model was deployed.

2 2
0 482

I would like to define an advanced filter within my pivot table that allows me to look at diagnosis codes, or at procedure codes - but I do not want to hard code values within the pivot table definition (get the %OR defined).

I would like to be able to allow my dashboard user to chose what specific diagnosis codes or procedure codes they are interested in. So for example one user may want to look for # of patients with cancer dx or patients who have had a radiation procedure.

How can I accomplish this OR feature using dashboard filters?

0 2
0 413

Learning Services Live Webinars are back!

At this year’s Global Summit, InterSystems debuted InterSystems IRIS Data Platform™, a single, comprehensive product that provides capabilities spanning data management, interoperability, transaction processing, and analytics. InterSystems IRIS sets a new level of performance for the rapid development and deployment of data-rich and mission-critical applications. Now is your chance to learn more!

3 1
0 600
Article
· Dec 12, 2019 2m read
Creating Portlets in DeepSee

What is a portlet?

The simple answer is: a custom widget. A portlet can exist by itself on a DeepSee dashboard, it can be used along side standard DeepSee widgets, or along side other portlets. The rendering of the custom widget is completely user defined. This means you can embed a web page, create a form to perform any sort of action needed based on the data on your dashboard, use third party charting libraries, or simply display data from outside of a DeepSee cube.

How to get started

6 1
0 526

InterSystems IRIS Business Intelligence allows you to keep your cubes up to date in multiple ways. This article will cover building vs synchronizing. There are also ways to manually keep cubes up to date, but these are very special cases and almost always cubes are kept current by building or synchronizing.

2 1
0 658

I was approached recently by and end use who wanted to perform analysis of their databases and see how they could save some space by picking data good for deletion without harming the application. As part of investigation, they wanted to know sizes of globals within datasets. This can be achieved by various means but all of them provide data in text form only.

I thought I might be a good tool for database administrators in general - to see global sizes in a graphical way.

2 1
0 385
Article
· Jul 19, 2022 7m read
Showing dates in missing periods

When we collect temporary data (the number of purchases in the store, the number of comments on the post), it may happen that there is no data for a certain period of time. In this case, this time period (hour, day, month) is not represented in the database, that is, there is not a single row for this period. In other words, there are no rows in the database for this period.

3 1
0 495

Hey Developers!

Do you want to reap the benefits of the advances in the fields of artificial intelligence and machine learning? With InterSystems IRIS and the Machine Learning (ML) Toolkit it’s easier than ever.

Join InterSystems Sales Engineers, @Sergey Lukyanchikov and @Eduard Lebedyuk, for the Machine Learning Toolkit for InterSystems IRIS webinar on Tuesday, April 23rd at 11 a.m. EDT to find out how InterSystems IRIS can be used as both a standalone development platform and an orchestration tool for predictive modelling that helps stitch together Python and other external tools.

3 1
0 510
Question
· Apr 29, 2024
IRIS Dashboard/Deepsee Queries

Hi Everyone,

We are using SQL based KPI's to display reports in IRIS dashboards. We have applied the filter functionality in these SQL based KPI reports.

I need your help for below scenario.

Below is my full report. Filter is applied on Name and Subject Name in this report.

Now I have used filter on Name and selected values 'Virat' and 'Big Show'

0 1
0 146
Announcement
· Mar 15, 2021
FHIR Analytics

Hi developers,

We have received quite a lot of interest in using SQL on FHIR data. As you know, FHIR data is encoded in the form of a complex directed graph, and thus you can not easily query it with traditional SQL queries or business intelligence tools. Some customers have noticed that the "FHIR search tables" in IRIS for Health have flattened part of the FHIR graph, and have tried to use them for analytics. This is an undocumented and unsupported part of IRIS for Health, and can change without notice.

10 1
0 416

Hello community, I need to solve a complex but trivial issue.

Given:

Two tables "Comment" and "Post". Each one contains an "Author" field, which is essentially a user ID. In these tables, each user ID represents an author. The goal is to count all participants together and then group them by month, language, and other metrics.

The question is how to do this within the IRIS ecosystem. Is it even possible to take two tables, get distinct data from them and then combine into one cube?

0 1
0 190

Hi Community,

The new video is available on InterSystems Developers YouTube Channel:

Collecting Healthcare Data with Alexa

https://www.youtube.com/embed/tl7heBWRrVQ
[This is an embedded link, but you cannot view embedded content directly on the site because you have declined the cookies necessary to access it. To view embedded content, you would need to accept all cookies in your Cookies Settings]

0 1
0 302

Dear Folks,

I have recently studied deepsee and developed few dashboards needed for our web app users. I am trying to embed them in our existing web app which uses angular with delegated user access. I need to embed the native IRIS dashboard into it. ( I can't use Highcharts or any other js tools).

How do I setup the dashboards to work with delegated authentication (Without providing access to management portal or other parts) ? Also should I use the default csp/{Namespace}/_DeepSee.UserPortal.DashboardViewer.zen? or any other web application URL ?

Thanks

0 1
0 213

Preview releases are now available for InterSystems IRIS Advanced Analytics, and InterSystems IRIS for Health Advanced Analytics! The Advanced Analytics add-on for InterSystems IRIS introduces IntegratedML as a key new feature.

9 1
3 636

Hi, Community!

I’m sure you are using Developer Community analytics built with InterSystems Analytics technology DeepSee:

You can find DC analytics n InterSystems->Analytics menu.

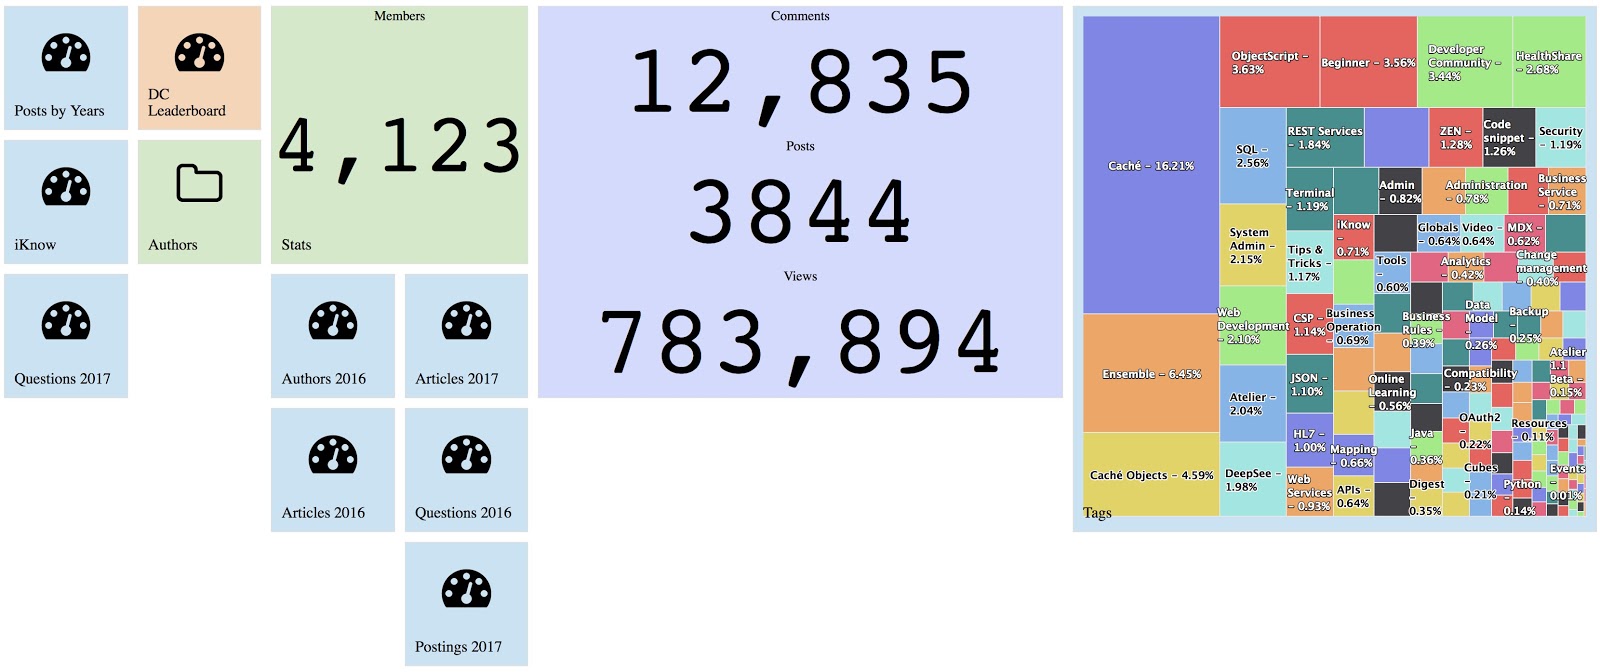
DC Analytics shows interactive dashboards on key figures of DC entities: Posts, Comments, and Members.

Since the last week, this analytics project is available for everyone with source code and data on DC Github!

2 1
1 637

I want to have a generic PercentOfAll measure that can be used for any dimension of the cube. This PercentOfAll should act like Count, but instead of showing the number of rows in a cell, it will show the percentage (100*number of rows for that member/all rows) .It should not matter what dimension is being viewed. Ex

There are a total of 100 rows in the source class.

1 1
0 374

Making a Chart using Intersystems IRIS + Python

How to use the IRIS Native API in Python to access globals and plot some charts.

Why Python?

With a large adoption and use in the world, Python have a great community and a lot of accelerators | libraries to deploy any kind of application.
If you are curious (https://www.python.org/about/apps/)

4 1
0 472

When we are at the starting stage of BI project development, we must remember that it is crucial to select the right tool for its implementation. Today we want to show you how one of the principal functionality of dashboards is implemented in different BI systems. Let's talk about drill down from both points of view: the dashboard development, and the convenience and clarity for the end user. We will touch on the applications of this technology in IRIS BI, Power BI and Tableau.

3 1
0 814

Creating information dashboards, pivot tables, and widgets is an important step in analysis that provides valuable sources of information for informed decision-making. The IRIS BI platform offers many opportunities to create and customize these elements. In this article, we will take a closer look at the basic techniques for developing them and the importance of using them.

7 1
0 487

Hey Developers,

Learn about InterSystems Reports, powered by Logi Analytics, a report-generation tool that enables you to rapidly create and view visual reports of your data.

A Look at InterSystems Reports

https://www.youtube.com/embed/mmA5ArAMLSU
[This is an embedded link, but you cannot view embedded content directly on the site because you have declined the cookies necessary to access it. To view embedded content, you would need to accept all cookies in your Cookies Settings]

3 1
0 373