Comparison of drilldowns on various technologies (PowerBI, Tableau, IRIS BI)
When we are at the starting stage of BI project development, we must remember that it is crucial to select the right tool for its implementation. Today we want to show you how one of the principal functionality of dashboards is implemented in different BI systems. Let's talk about drill down from both points of view: the dashboard development, and the convenience and clarity for the end user. We will touch on the applications of this technology in IRIS BI, Power BI and Tableau.
In IRIS BI, cubes initially provide hierarchies according to which drilldown will later occur. Accordingly, if we need different drilldowns on widgets, we should prepare separate hierarchies in the cube for them.
First, you need to use the Architect - a cube-building tool that can create hierarchies for drilldown. To make a drilldown, you need to drag the field to the Dimensions line. After that, a hierarchy will be established. To add the next level of Drilldown, you should drag the field into the newly created hierarchy.
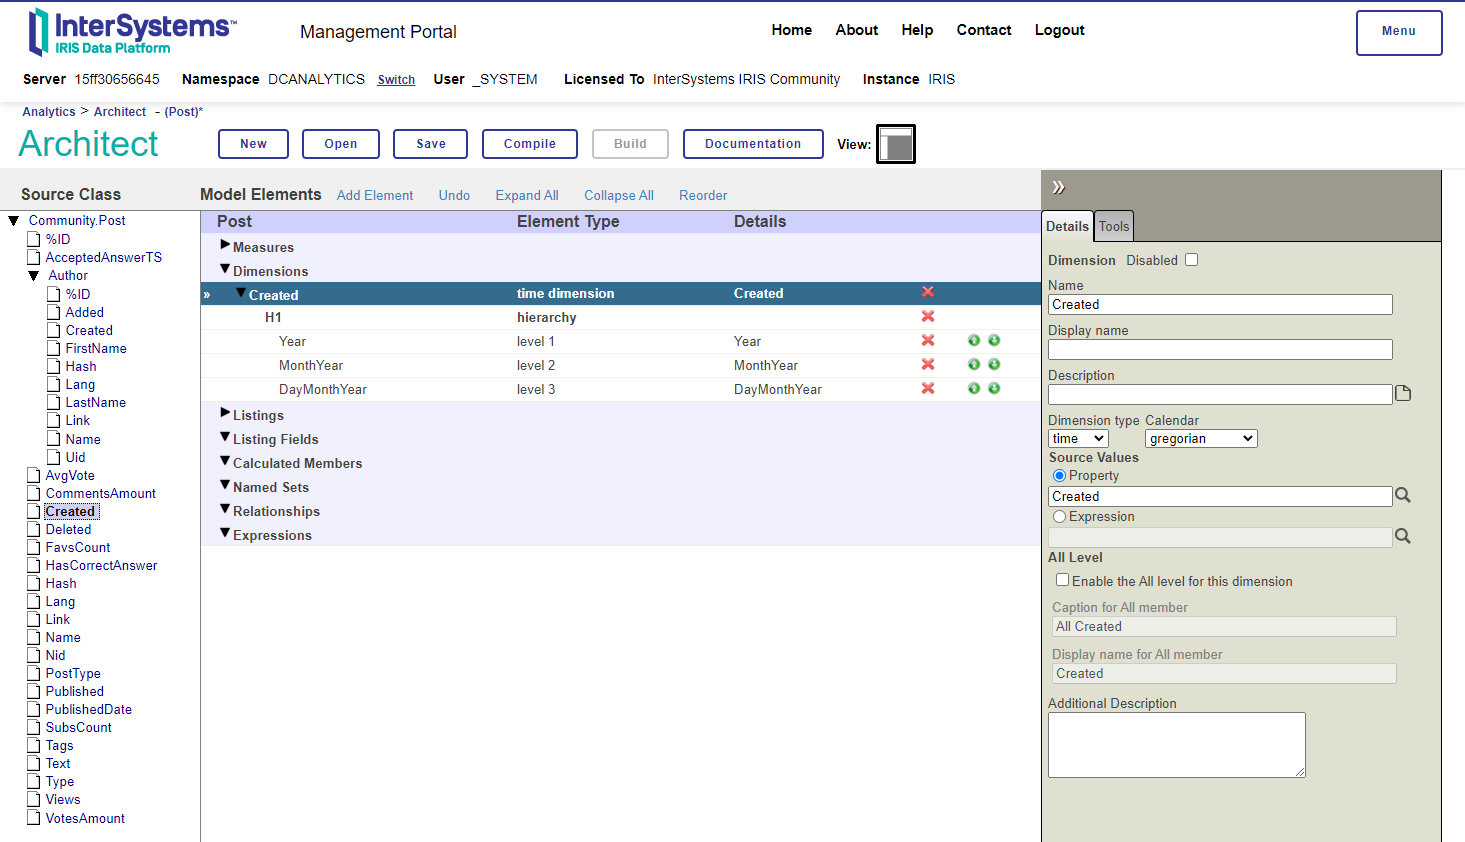
In this example, there are 3 levels of hierarchy: AuthorName -> PostType -> PostName. To view Drilldown in Analytics, you need to create Pivots.
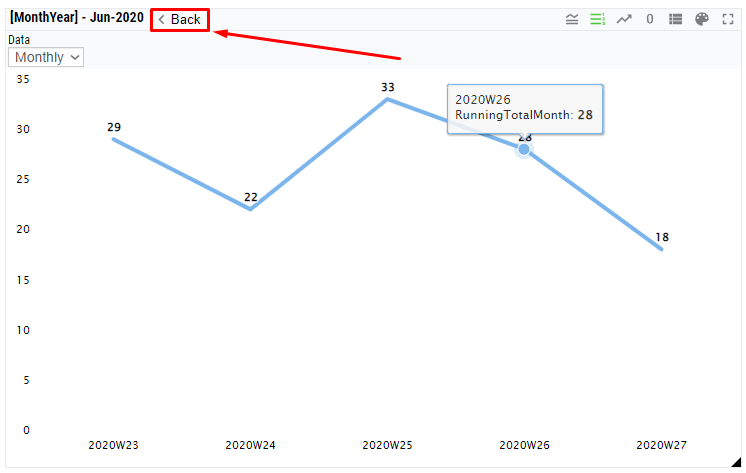
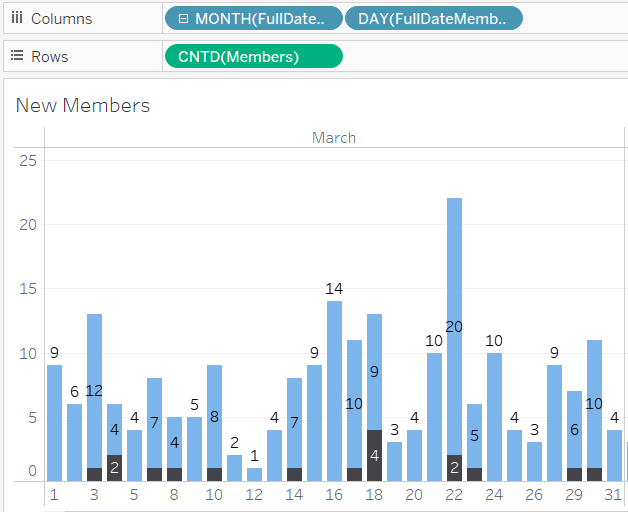
When viewing widgets, we just left-click on the data point we need, and the next level will be displayed for this current point, for example, weeks in a month.
A button to return to the previous level appears above the widget.
This BI system is very convenient and understandable for the end user. However, it makes you work with the functionality in only one specific way, without the ability to configure anything. As a developer, you need to create the hierarchy in one place and the widget itself in another. It does not seem like a convenient approach, but it immediately allows you to use the created hierarchy in dashboards and in the Analyzer.
In Power BI, a drill-down hierarchy is built inside each widget. We sequentially add any fields to the x axis, setting them in the hierarchical order.

It lets us organize the hierarchy the way we want to be able to drill down from any data files even if they are not united by a hierarchical structure. Of course, we can prepare the hierarchy in the representation of our table and put it on the x-axis, but it isn't necessary.
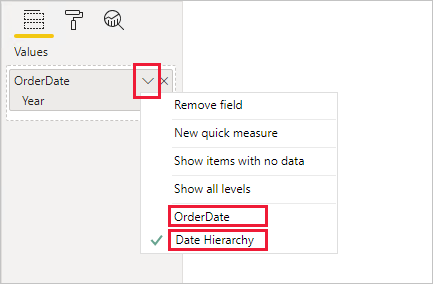
Also, the date field itself is broken into a hierarchical structure when added to the widget. You can choose which levels of the hierarchy to keep, or even turn the hierarchy back into a field.
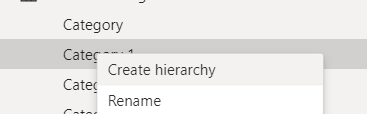
If necessary, it is possible to create your own hierarchy. To do this, right-click on the field and select "Create Hierarchy".
After that, a separate element will appear in the Hierarchy. You can add new fields and change the order. After all the necessary changes have been made, you need to click on “Apply Level Changes”.

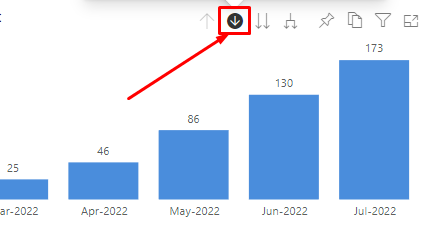
When browsing, there are 2 ways to interact with hierarchies. One of them is similar to IRIS BI. First, you need to select the drilldown mode by clicking on the single down arrow. Then, when in a drilldown mode already, we will be able to move to the next level of data. To do that we will need to left-click on a specific column on the chart.
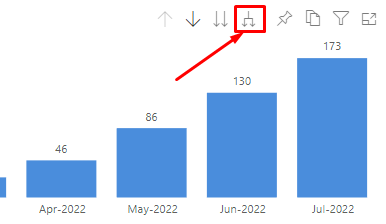
The second way allows you to move to the next level of the hierarchy for the entire widget. For example, you can display information by weeks instead of months. To do this, use the button with a bifurcated arrow.
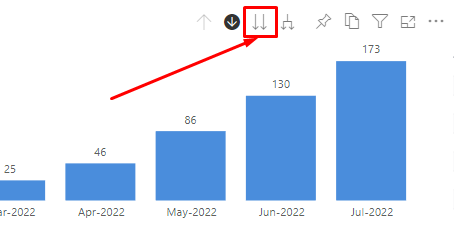
The button with two down arrows allows you to expand the current state of the widget to the next level in the hierarchy. For example, you can first open a specific month to view its weeks, and theng o one level down and see all the days of that month.
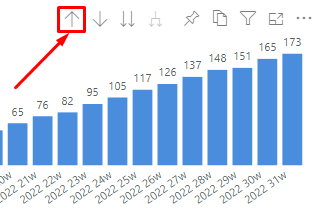
You can return to a higher level in the same way for both methods. To do it, press the button with the up arrow.
This BI system gives us a lot of control in using drilldown, but you need to explain to end users how to work with this system because the UI isn't understandable at first glance.The developer can easily and conveniently change the structure of hierarchies.
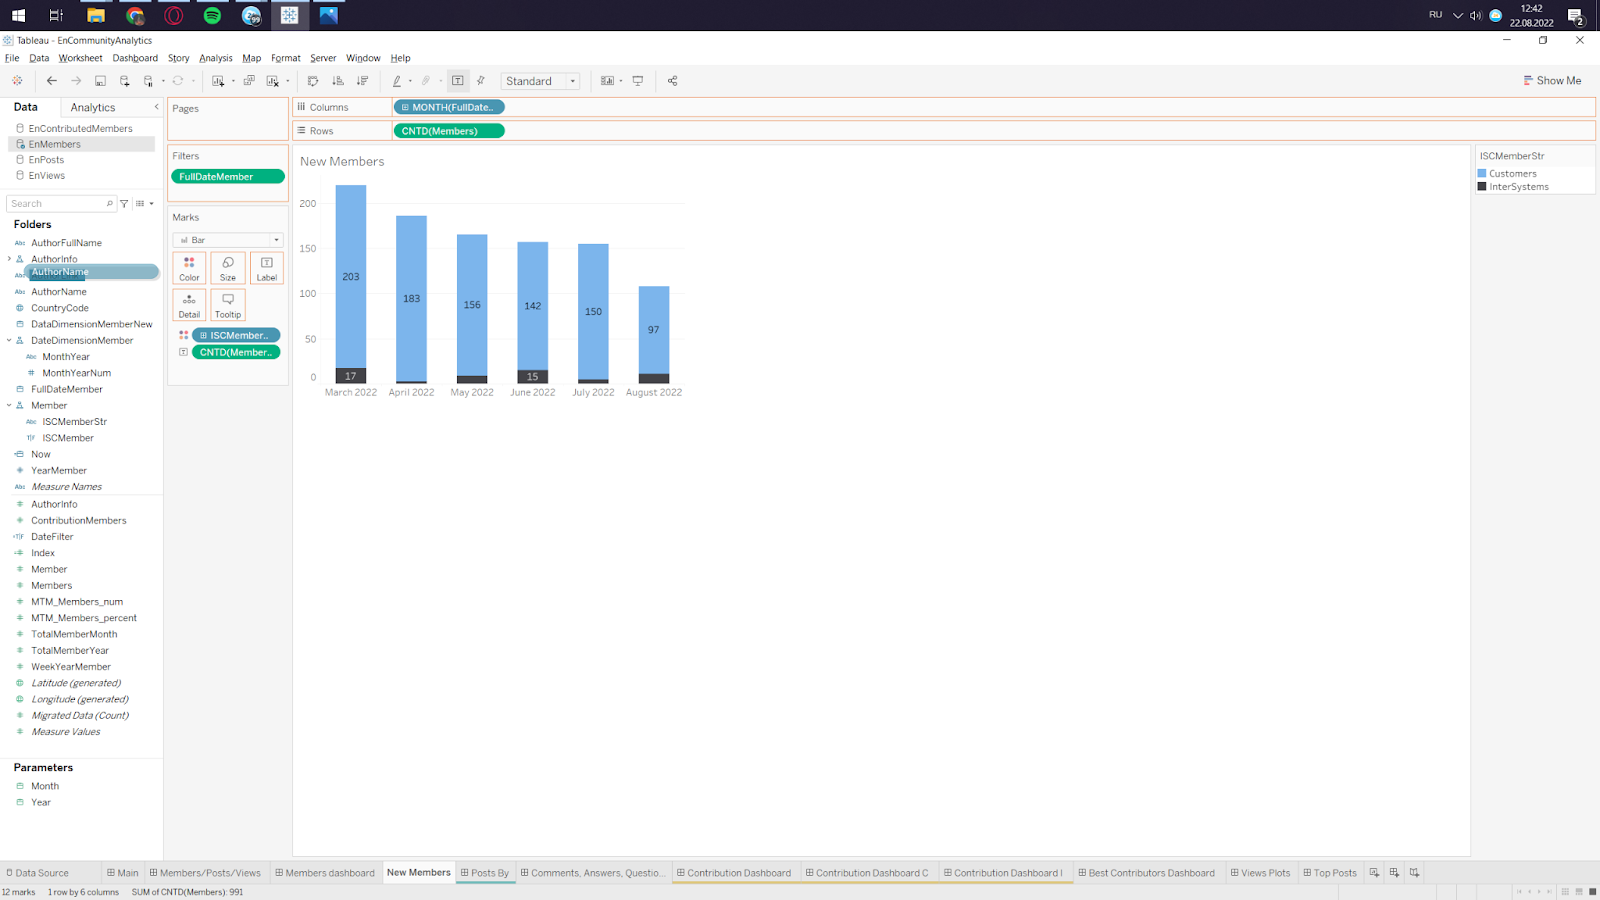
Drilldowns in Tableau can be activated on dates or custom hierarchies.

Creating a Hierarchy
In order to create your own hierarchy, simply drag one field onto another.
In this case, the field that was dragged will be lower in the hierarchy. You can also change the order and add fields to existing hierarchies.
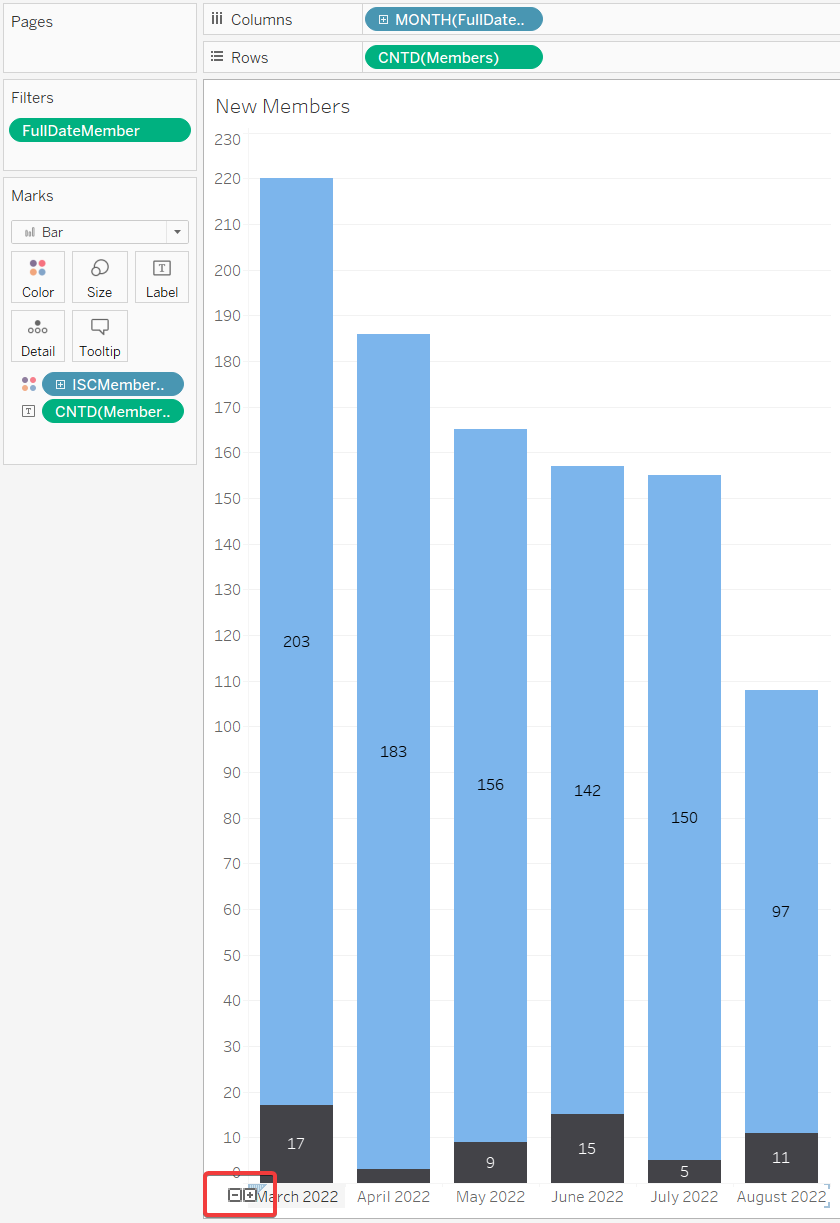
You can expand or collapse the hierarchy by clicking on the “+” sign on the left at the beginning of the x-axis.
If you right-click on a date, you can choose not only the format of the date but also how it will be displayed.
If you select a date from the 1st list using a hierarchy, a hierarchy element will be added to the column.
When you choose the 2nd option, the date format is replaced.

Default settings of drilldown functionality do not allow the end user to drill down to a particular data point. It only lets us see the level completely. To give the user such an opportunity, developers need to create a Set Action drill down.
First, you need to create a Set by right-clicking on the data field and selecting Create > Set. In this case, our first set should be based on Category which is the first field we want to drill down to. You can leave the default settings for the created Set.

The next step is to create a calculated field that, if a certain data point is selected, will bring the related data points to the next level of hierarchy. The calculated field code will look like this:
IF [Set_name]
THEN [next_level_field]
ELSE “”
END
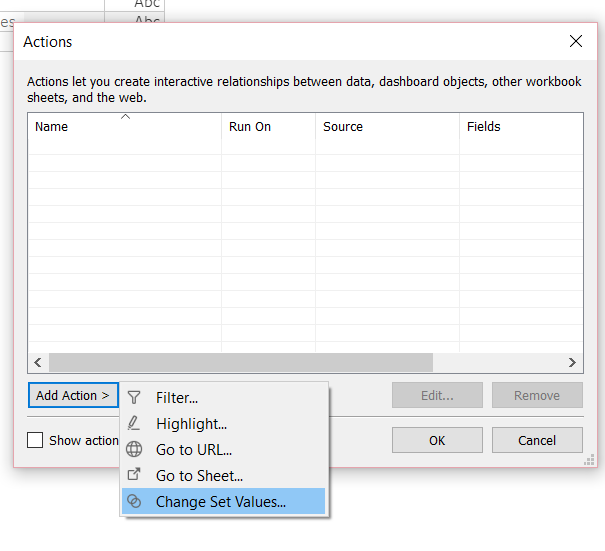
After creating the calculated field, place it on the widget's x-axis. After that, you need to create a Set action by clicking on Worksheet > Actions (or use the shortcut Ctrl+Shift+A if you are using Windows). A window will pop up, and you will be able to choose Add Action > Change Set Values.
In terms of configuring the Action itself, the following is where you need to pay attention:

1 – Never forget to name this field!
2 – Here you will define where you want to run the action - on select, on hover, or on menu.
3 – This is the set you want to be affected by the selection/hover/menu.
4 – This is what the selection will result in. To be fair, in most of the cases I use “Remove all values from set”.
Now the user, when clicking on a data point, will expand the next level only for that point.
Tableau requires the most effort from the developer to create a drill down, but in return, it allows us to determine how the end user will be able to interact with the technology.
From the box, all BI systems have the same problem with drilldown. On charts, we can see only the dates, where we have some data. For example, when we can have some days when no posts were published, these days will be skipped on charts.
To solve this problem in IRIS BI and Tableau, we need to create a table with all dates in the data source and link it to all data tables to use the date column from this table in charts. In Power BI we can create a calculated date table using Dax, so we don’t need to modify our data source. We talked about this problem in our previous article(Showing dates in missing periods | InterSystems Developer Community |).
In this article, we tried to show you the pros and cons of working with drilldown using different technologies. We hope that we have managed to help you choose the technology that is best suited for your project.
Comments
Thanks for the great article...This article help me more points need to be check while create dashboards and drilldown in PBI.