This tag relates to the discussions on the development of analytics and business intelligence solutions, visualization, KPI and other business metrics management.
Today, is important analyze the content into portals and websites to get informed, analyze the concorrents, analyze trends, the richness and scope of content of websites. To do this, you can alocate people to read thousand of pages and spend much money or use a crawler to extract website content and execute NLP on it. You will get all necessary insights to analyze and make precise decisions in a few minutes.
A simple data analysis example created in IntegratedML and Dashboard
Based on InterSystems' Integrated ML technology and Dashboard, automatically generate relevant predictions and BI pages based on uploaded CSV files. The front and back ends are completed in Vue and Iris, allowing users to generate their desired data prediction and analysis pages with simple operations and make decisions based on them.
I've asked a lot of questions leading up to this, so I wanted to share some of my progress.
The blue line represents the number of messages processed. The background color represents the average response time. You can see ticks for each hour (and bigger ticks for each day). Hovering over any point in the graph will show you the numbers for that period in time.
This is super useful for "at a glance" performance monitoring as well as establishing patterns in our utilization.
When you have been using cubes for business intelligence in a namespace for some time, you may find that there are many cubes in the namespace, only some of which are actively being used. However, it can be difficult to tell which cubes users are or are not querying, and maintaining unused cubes can be costly both in terms of storage and of computation to keep them up to date. This article provides some suggestions and examples for monitoring which cubes are in active use, and for removing cubes that you determine are no longer necessary.
Hi all. Today we are going to upload a ML model into IRIS Manager and test it.
Note: I have done the following on Ubuntu 18.04, Apache Zeppelin 0.8.0, Python 3.6.5.
Introduction
These days many available different tools for Data Mining enable you to develop predictive models and analyze the data you have with unprecedented ease. InterSystems IRIS Data Platform provide a stable foundation for your big data and fast data applications, providing interoperability with modern DataMining tools.
Sometimes you when create a pivot in Analyzer and see the result that shouldn't exist - don't run to create a WRC ticket, try to call the IRIS BI reset function first:
The source class of a DeepSee cube has a property referencing a different class:
Class ClassA Extends %Persistent {
     Property P1 As ClassB;
}
When records in class B change, the ^OBJ.DSTIME global for Class A will not be automatically updated. This means that synchronization of cubes based on source class A will not reflect the changes occurred to property P1. This post will help you determine the best way to achieve synchronization of properties referencing a different class
I just wrote up a quick sample to help a colleague load data into IRIS from R using RJDBC, and figured it's worth sharing here for future reference.
Ultimately it was pretty simple, aside from IRIS not liking "." in column names; the workaround is to just rename the columns. Someone better at R than me could probably provide some generic approach.
In today's data landscape, businesses encounter a number of different challenges. One of them is to do analytics on top of unified and harmonized data layer available to all the consumers. A layer that can deliver the same answers to the same questions irrelative to the dialect or tool being used.
Over the last couple of weeks the Solution Architecture team has been working to finish off our 2019 workload: this included open-sourcing the Readmission Demo that was brought to HIMSS last year, so we could make it available to anyone looking for an interactive-way of exploring the tooling provided by IRIS.
System Monitor is a flexible and highly configurable tool supplied with Caché (Ensemble, HealthShare), which collects the essential metrics of the operating system and Caché itself. System Monitor also notifies administrators about issues with Caché and the operating system, when one or several parameters reach the admin-defined thresholds.
Running predictive models natively in an InterSystems IRIS Business Process has of course always been the goal of our PMML support, but somehow never made it into the kit because there were a few dependencies and choices that needed addressing and answering. Anyhow, thanks to some pushing and code kindly provided by @Amir Samary (Thanks again Amir!), we finally got it wrapped in a GitHub repo for your enjoyment, review and suggestions.
We offer you to embed business intelligence into your applications in order to give your users an opportunity to ask and answer sophisticated questions about their data. Typically, your application will include customizable dashboards that can provide insight into data from Business Intelligence models known as cubes.
In contrast with traditional BI systems that use static data warehouses, Business Intelligence keeps being constantly synchronized with the live transactional data.
With the release of InterSystems IRIS, we're also making available a nifty bit of software that allows you to get the best out of your InterSystems IRIS cluster when working with Apache Spark for data processing, machine learning and other data-heavy fun. Let's take a closer look at how we're making your life as a Data Scientist easier, as you're probably already facing tough big data challenges already, just from the influx of job offers in your inbox!
With InterSystems IRIS 2022.2, we introduced Columnar Storage as a new option for persisting your IRIS SQL tables that can boost your analytical queries by an order of magnitude. The capability is marked as experimental in 2022.2 and 2022.3, but will "graduate" to a fully supported production capability in the upcoming 2023.1 release.
The product documentation and this introductory video, already describe the differences between row storage, still the default on IRIS and used throughout our customer base, and columnar table storage and provide high-level guidance on choosing the appropriate storage layout for your use case. In this article, we'll elaborate on this subject and share some recommendations based on industry-practice modelling principles, internal testing, and feedback from Early Access Program participants.
How to use the IRIS Native API in Python to access globals and plot some charts.
Why Python?
With a large adoption and use in the world, Python have a great community and a lot of accelerators | libraries to deploy any kind of application.
If you are curious (https://www.python.org/about/apps/)
When designing a hierarchy in DeepSee, a child member must have only one parent member. In the case where a child corresponds to two parents, the results can become unreliable. In the case where two similar members exist, their keys must be changed so that they are unique. We will take a look at two examples to see when this happens and how to prevent it.
The simple answer is: a custom widget. A portlet can exist by itself on a DeepSee dashboard, it can be used along side standard DeepSee widgets, or along side other portlets. The rendering of the custom widget is completely user defined. This means you can embed a web page, create a form to perform any sort of action needed based on the data on your dashboard, use third party charting libraries, or simply display data from outside of a DeepSee cube.
When we collect temporary data (the number of purchases in the store, the number of comments on the post), it may happen that there is no data for a certain period of time. In this case, this time period (hour, day, month) is not represented in the database, that is, there is not a single row for this period. In other words, there are no rows in the database for this period.
The following post outlines a more flexible architectural design for DeepSee. As in the previous example, this implementation includes separate databases for storing the DeepSee cache, DeepSee implementation and settings, and synchronization globals. This example introduces one new databases to store the DeepSee indices. We will redefine the global mappings so that the DeepSee indices are not mapped together with the fact and dimension tables.
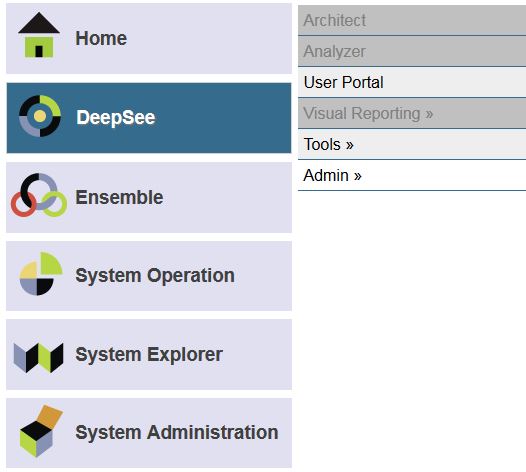
Whether you are accessing DeepSee for the first time ever or you are configuring DeepSee on a new instance, there are two common issues that are encountered after clicking on the “DeepSee” option in the System Management Portal.
Creating information dashboards, pivot tables, and widgets is an important step in analysis that provides valuable sources of information for informed decision-making. The IRIS BI platform offers many opportunities to create and customize these elements. In this article, we will take a closer look at the basic techniques for developing them and the importance of using them.
I was approached recently by and end use who wanted to perform analysis of their databases and see how they could save some space by picking data good for deletion without harming the application. As part of investigation, they wanted to know sizes of globals within datasets. This can be achieved by various means but all of them provide data in text form only.
I thought I might be a good tool for database administrators in general - to see global sizes in a graphical way.
 By replies
 Open Exchange app

.png)


.png)