By update
Hi:
Currently we are using an older Healthshare instance but I am not opposed to using IRIS as we will upgrade eventually.
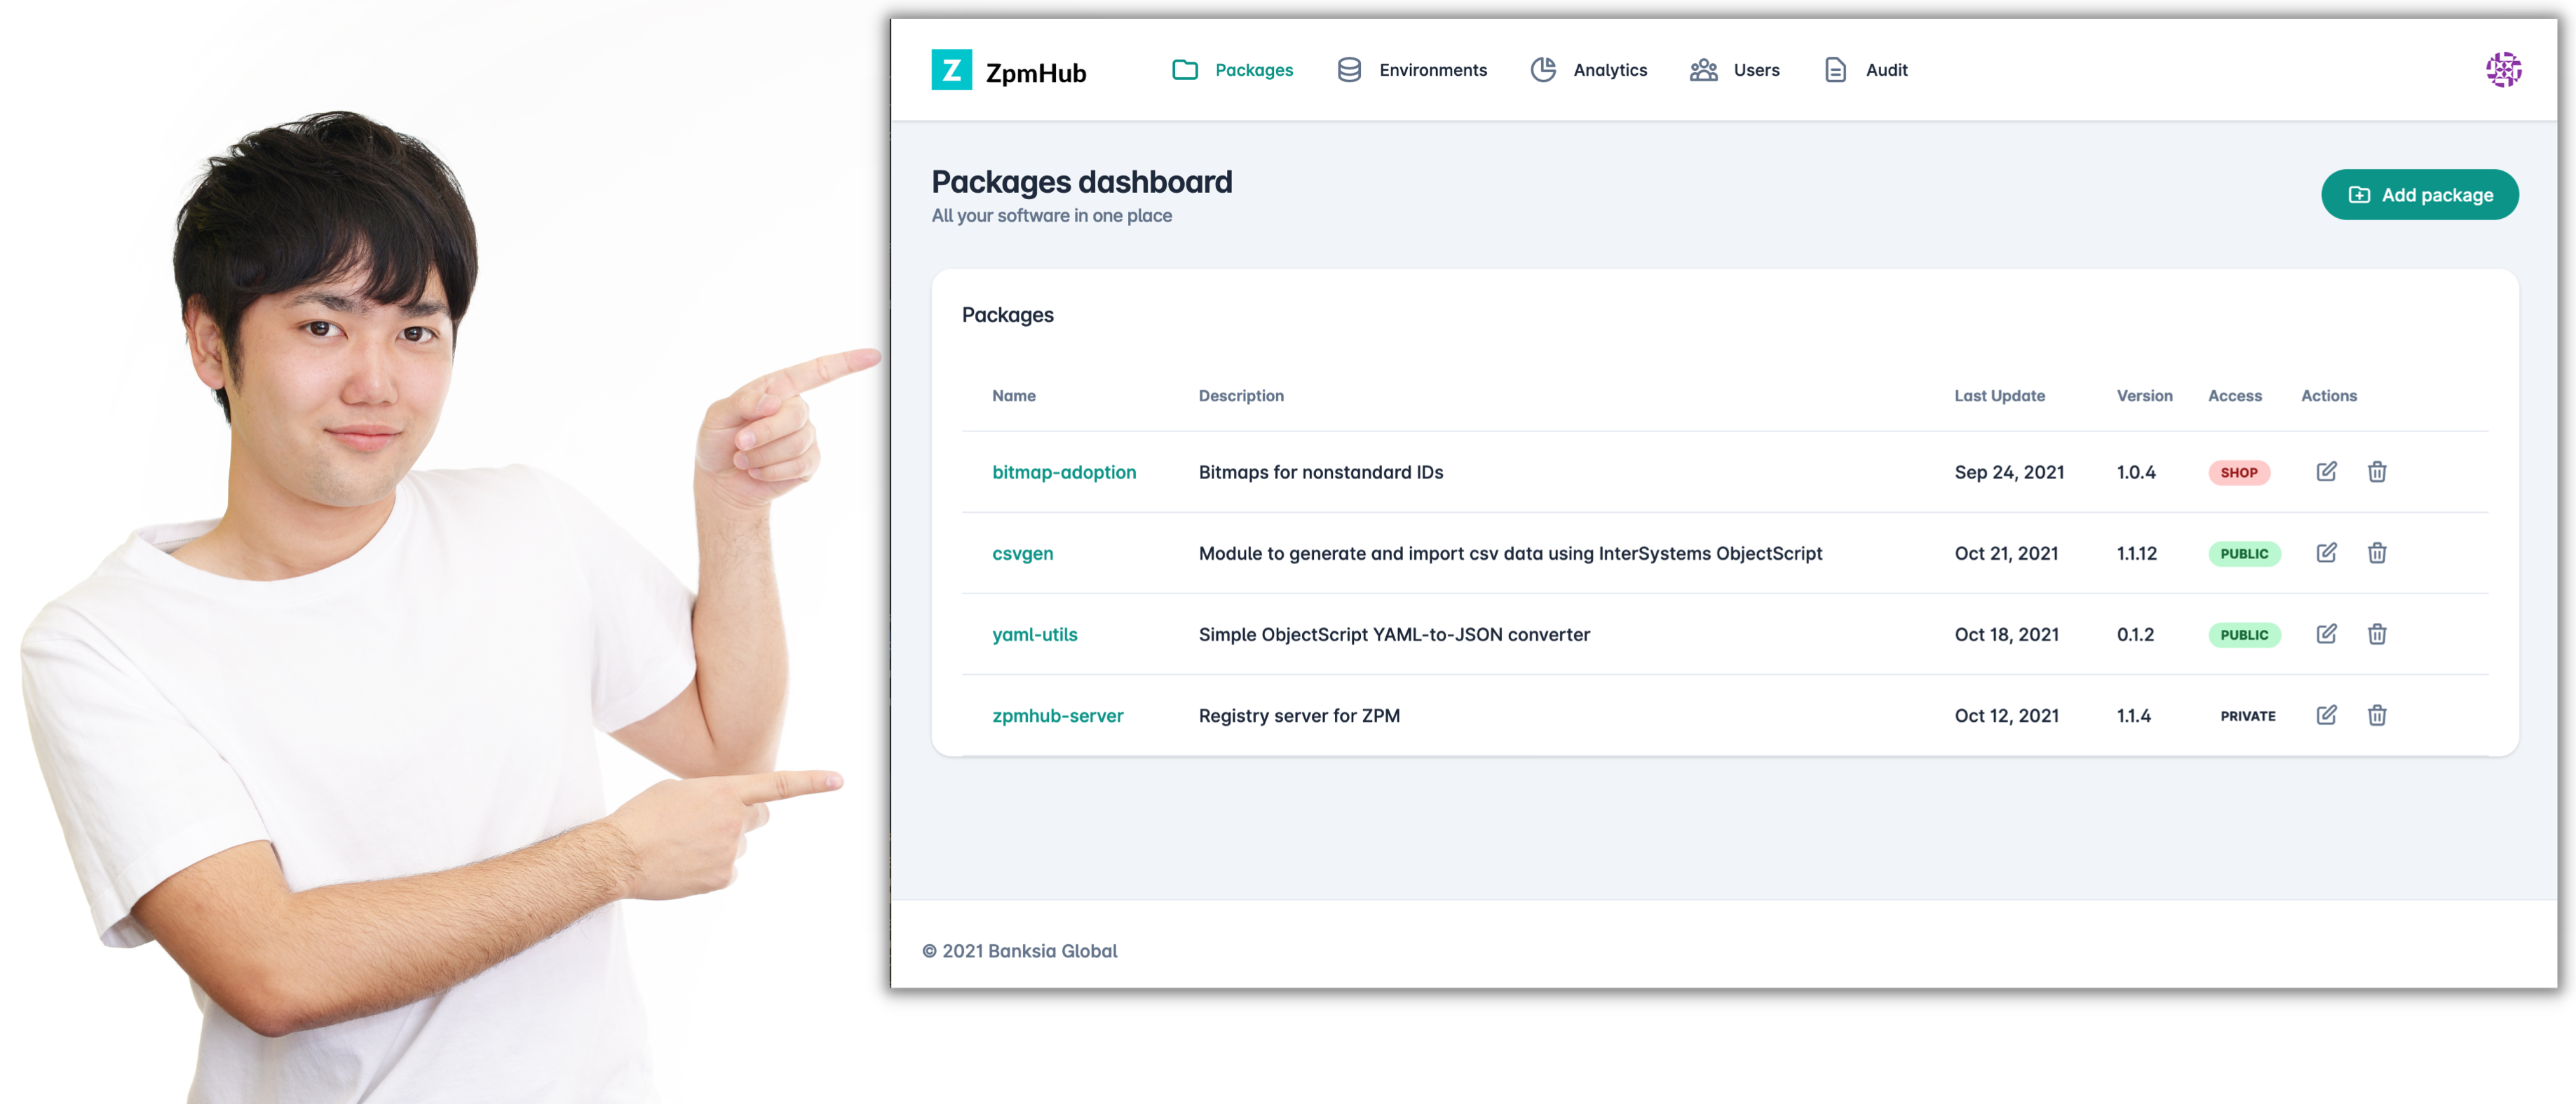
Currently for monitoring productions we have a Montior screen. We have both the Queues page and a Deepsee dashboard which has current status of our services. The issue with the Deepsee method we currently have with traffic lights is 1) the page is a bit slow to load the metrics 2) any new services from the team a new widget needs created and although this is easy enough to do it just is time consuming.
.png)
 Open Exchange app